Definition and Purpose
The Z-test is a statistical hypothesis test used to determine whether there is a significant difference between sample means when the population variance (or standard deviation) is known. It is especially appropriate for large sample sizes (n ≥ 30) and assumes that the data follows a normal distribution.
This test evaluates how far the sample mean deviates from the population mean in terms of standard errors. It is commonly applied in hypothesis testing for comparing population means or proportions.
Key Characteristics of the Z-Test
- Used for hypothesis testing: The Z-test helps determine if a sample statistic (e.g., the sample mean) significantly deviates from a known population parameter.
- Requires known population standard deviation (σ): Unlike the t-test, which estimates standard deviation from the sample, the Z-test assumes that σ is known.
- Applicable for large sample sizes: A minimum sample size of 30 or more is typically required to ensure reliability under the Central Limit Theorem.
- Types of Z-tests:
- One-sample Z-test: Compares the mean of a single sample to a known population mean.
- Two-sample Z-test: Compares the means of two independent samples.
Z-Test Formula
The formula for the Z-test statistic is:
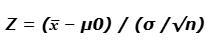
Where:
- xˉ Sample mean
- μ0= Population mean
- σ= Population standard deviation
- n = Sample size
This Z-score indicates how many standard deviations the sample mean is from the population mean.
Hypothesis Testing with the Z-Test
The process of hypothesis testing involves:
- Setting up the hypotheses:
- Null hypothesis (H₀): Assumes no effect or no difference (e.g., μ=μ0\mu = \mu_0)
- Alternative hypothesis (H₁ or Hₐ): Indicates a deviation from the null (e.g., μ≠μ0\mu \ne \mu_0, μ>μ0\mu > \mu_0, or μ<μ0\mu < \mu_0)
- Calculating the Z-statistic using the formula.
- Comparing the Z-score with the critical value based on the chosen significance level (commonly α = 0.05).
- Making a decision:
- If the Z-score exceeds the critical value, reject H₀.
- Otherwise, fail to reject H₀.
Example 1: Academic Scenario
A professor claims that first-year students have an average IQ above the general population mean of 100. A random sample of 30 students yields an average IQ of 117 with a known population standard deviation of 27.
- H₀: μ=100\mu = 100
- Hₐ: μ>100\mu > 100
- xˉ=117, σ=27, n=3
Z=117−10027/30=174.929=3.44
Since 3.44 > 1.96 (critical value for α = 0.05, one-tailed), we reject the null hypothesis. The professor’s claim is statistically supported.
Example 2: Medical Scenario
A doctor asserts that a hospital treats more than 100 diabetic patients with an average blood glucose level above 234 mg/dL. A test on 90 patients results in:
- Mean = 279 mg/dL
- Standard deviation = 18
- Population mean = 234
- Significance level = 22.50 (used for comparison)
Z=279−23418/90=451.89=23.80
Since the Z-score (23.80) is greater than the significance level threshold (22.50), the doctor’s claim is supported by the data.
Z-Score Interpretation
The Z-score quantifies how far a sample statistic is from the population parameter in units of standard deviation:
- Positive Z-score: Sample mean is above the population mean.
- Negative Z-score: Sample mean is below the population mean.
Z-scores help normalize data and make probability comparisons between different data distributions possible—even if the distributions have different means or variances.
Z-Test Function in Excel
Excel provides a built-in function Z.TEST for hypothesis testing, particularly when working with large datasets and known population parameters.
Syntax:
Z.TEST(array, x, [sigma])
array: Range of sample data.x: Value to be tested (hypothesized population mean).sigma(optional): Known standard deviation of the population. If omitted, Excel uses the sample standard deviation.
Example:
Given the data set in A7:A14 → {6, 7, 8, 9, 5, 4, 10, 4}, we want to test whether the population mean is 4:
=Z.TEST(A7:A14, 4)
Result: 0.00052 (p-value)
Since the p-value is extremely small, the null hypothesis (that the population mean is 4) is likely to be rejected in favor of the alternative.
Example– Using the Z.TEST Function
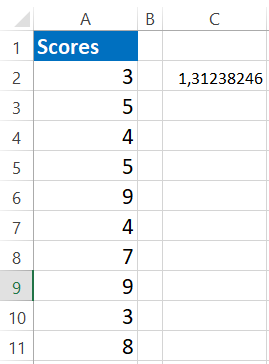
Take a look at the data presented below.
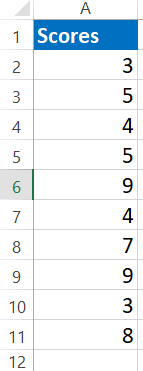
We will use this dataset to calculate the one-tailed p-value using the Z.TEST function.
For this example, let’s assume that the hypothesized population mean is 6.
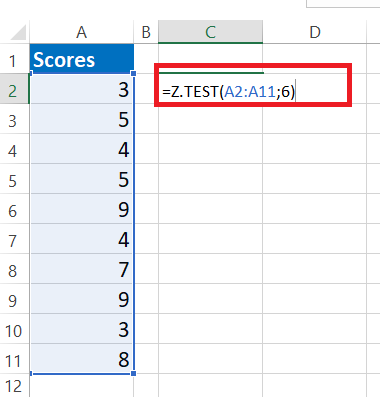
Here are the steps to use the Z.TEST formula in Excel:
- In an Excel cell, begin by typing the
Z.TESTfunction. -
Select the data range containing the sample scores, for example, from A2 to A11.
-
The next argument is the hypothesized mean (
x). Since we are assuming the population mean to be 6, enter this value. -
The third argument (standard deviation) is optional, so you can simply close the formula at this point.
Excel will return the one-tailed p-value based on the data and the specified mean.
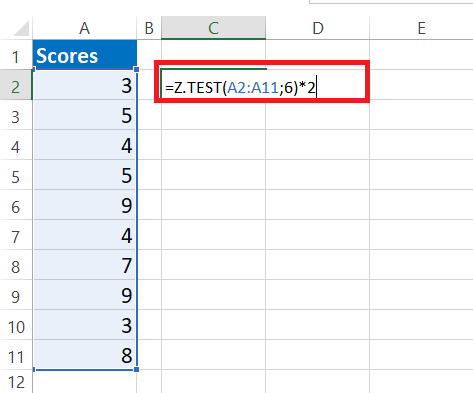
- This is a one-tailed Z.TEST p-value. To get the two-tailed Z.TEST p-value, multiply this result by 2.
Example – Performing a Z.TEST Using the Data Analysis Tool in Excel
We can carry out a Z.TEST in Excel by using the Data Analysis tool. This method is useful when comparing two sample means where the population variances are known. The Z.TEST helps us determine if there is a statistically significant difference between the two population means.
Hypothesis Setup
Before running the test, we define two hypotheses:
-
Null hypothesis (H0): μ₁ – μ₂ = 0
This means there is no difference between the two population means. -
Alternative hypothesis (H1): μ₁ – μ₂ ≠ 0
This states that the two population means are different.
Dataset
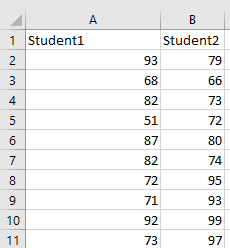
For this example, we use the scores of two students across several subjects. Our goal is to determine whether their average scores differ significantly.
Step-by-Step Procedure
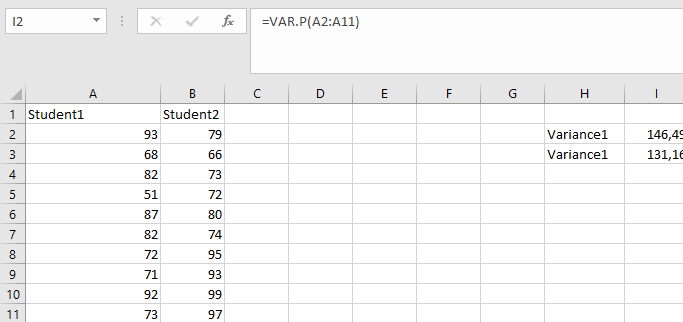
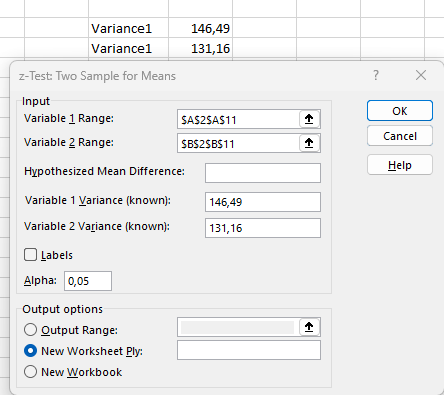
Step 1: Calculate Population Variances
Since the Z.TEST requires known population variances, start by calculating the variance for each student’s scores. Use Excel’s VAR.P function (which calculates variance for the entire population) on each student’s data range.
Step 2: Open the Data Analysis Tool
-
Go to the Data tab on the Excel ribbon.
-
Click on Data Analysis (if this option is not visible, you may need to add the Analysis ToolPak add-in).

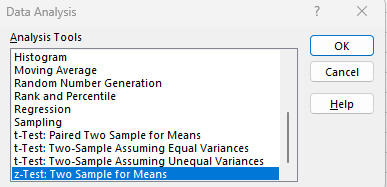
-
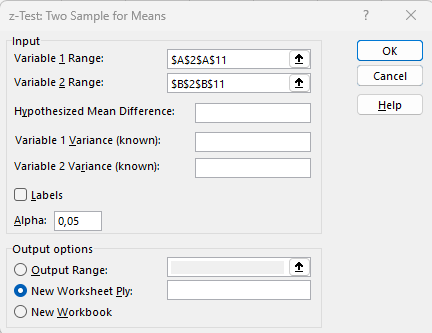
Scroll down and select Z-Test: Two Sample for Means, then click OK.
Step 3: Input Data Ranges
-
For Variable 1 Range, select the range of scores for Student 1.
-
For Variable 2 Range, select the range of scores for Student 2.
Step 4: Enter Known Variances
-
In the field Variable 1 Variance (known), input the variance value calculated for Student 1.
-
In Variable 2 Variance (known), input the variance value for Student 2.
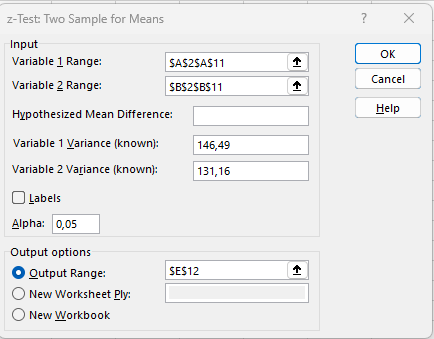
Step 5: Choose Output Range
-
Select where you want Excel to output the results. This can be a specific cell or a new worksheet.
-
Click OK to run the test.
Interpreting the Results
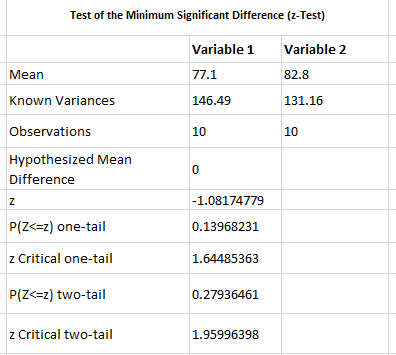
Once Excel outputs the result, it will include the calculated Z-statistic and the p-value.
To decide whether to reject the null hypothesis, use the following criteria for a two-tailed test:
-
Reject H0 if Z < – critical z-value or Z > critical z-value
The critical z-value is based on the chosen significance level (commonly α = 0.05), which corresponds to ±1.96 for a 95% confidence interval.
Example result:
-
Calculated Z = -1.0808
-
Critical z-values = ±1.9599
Since:
-
-1.0808 is not less than -1.9599
-
-1.0808 is not greater than 1.9599
The calculated Z-value does not fall into the rejection region. Therefore, we fail to reject the null hypothesis, indicating that there is no statistically significant difference between the average scores of the two students.
Important Notes
-
All input arguments must be numeric. If the data contains text or errors, Excel will return a
#VALUE!error. -
The data range must contain actual numeric values, or else you will get an
#N/Aerror. -
The Z-test assumes that the population standard deviations (or variances) are known, which is why we calculate and input variances here.
-
Typically, the Z-test is appropriate when the sample size is large (usually 30 or more data points) or when the population variance is known.