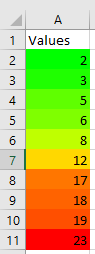
The following example demonstrates a three-color scale:
Sub ThreeColorScale()
    Dim Rg As Range
    ThisWorkbook.Worksheets("Sheet6").Activate
    Set Rg = Range("A2:A11")
    ' Remove any existing conditional formats
    Rg.FormatConditions.Delete
    ' Add a three-color scale conditional formatting
    Rg.FormatConditions.AddColorScale 3
    ' Modify the three-color scale settings
    With Rg.FormatConditions(1)
        .ColorScaleCriteria(1).Type = xlConditionValueLowestValue
        .ColorScaleCriteria(1).FormatColor.Color = vbGreen
        .ColorScaleCriteria(2).Type = xlConditionValuePercentile
        .ColorScaleCriteria(2).FormatColor.Color = vbYellow
        .ColorScaleCriteria(3).Type = xlConditionValueHighestValue
        .ColorScaleCriteria(3).FormatColor.Color = vbRed
    End With
    Set Rg = Nothing
End Sub
Explanation of Differences from Two-Color Scale:
The method AddColorScale() is called with the parameter value 3 to specify a three-color scale.
When modifying the scale, the middle color corresponds to the percentile value (xlConditionValuePercentile), which represents a statistical intermediate value.
This middle color is set to yellow, while the lowest and highest values are colored green and red respectively.