It is common to want to use multiple values to predict a single one. While this may not be obvious from the discussion in this chapter, it is possible to simultaneously use several variables as predictors.
Using two or more predictors simultaneously can often improve the accuracy of predictions compared to using only one predictor by itself.
Combining Predictors
In such a situation, SLOPE() and INTERCEPT() will not help, as they are not designed to handle multiple predictors. Instead, Excel provides you with TENDANCE() and LINEST() functions, which can handle both single and multiple predictor situations. This is why you won’t see SLOPE() and INTERCEPT() discussed further in this course. They serve as a useful introduction to the concepts involved in regression but are underpowered for handling multiple predictors, where the capabilities are better provided by TENDANCE() and LINEST() when you only have one predictor.
Note:
It is easy to conclude that TENDANCE() and LINEST() are analogous to SLOPE() and INTERCEPT(), but they are not. The results from SLOPE() and INTERCEPT() combine to form an equation based on a single predictor. LINEST() takes the place of SLOPE() and INTERCEPT() for both simple and multiple predictors. TENDANCE() only returns the results of applying the prediction equation. Just like with a single predictor variable, you can use TENDANCE() with more than one predictor variable to return predictions directly in the spreadsheet.
On the other hand, LINEST() does not return the predicted values directly, but it provides the equation that TENDANCE() uses to calculate the predicted values (and also gives a variety of diagnostic statistics that are discussed in Chapters 16 and 18). The name LINEST() is a contraction for « linear estimation. »
Example: Regression with Multiple Predictors
Figure resents the results of a multiple regression analysis along with results from two standard regression analyses.
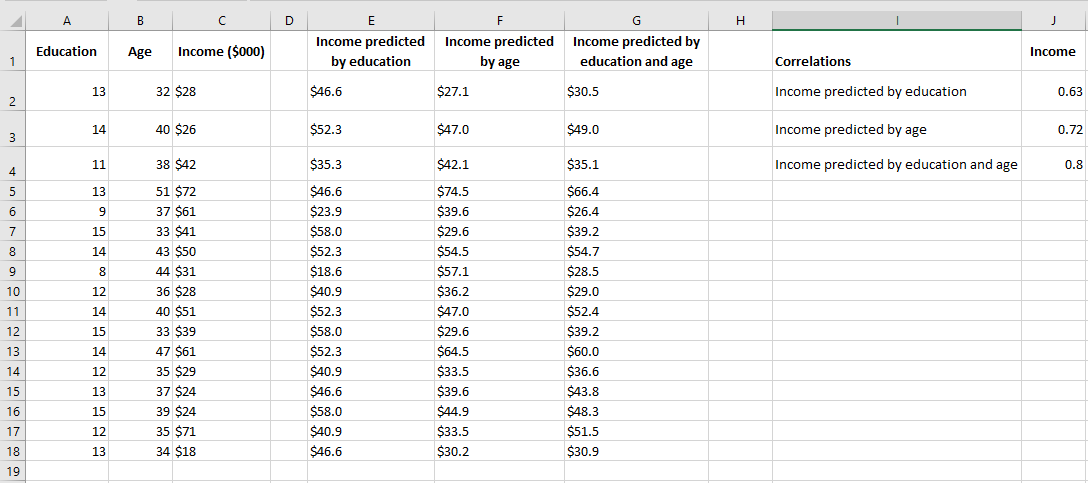
In the figure, columns E and F each contain predicted values based on a single variable, as discussed earlier in this chapter. Column E shows the regression results for income based on education, and column F shows the results for income based on age.
One way to evaluate the accuracy of the predicted values is to calculate their correlation with the predictors. These correlations are shown in cells J2 and J3 in Figure 4.18. In this sample, the correlation between education level and the predicted income by education is 0.63, and the correlation between age and the predicted income by age is 0.72. These are good, strong correlations and indicate that education and age are useful predictors of income. However, there might still be room for improvement.
In column G, the following array formula is used:
= TENDANCE(C2:C31, A2:B31)
Note the difference between this formula and, say, the one in column E: = TENDANCE(C2:C31, A2:A31)
Both formulas use the income values in C2:C31 as the known_y values. However, the formula in column E, which predicts income from education, only uses the education values from column A as known values. The formula in column G, which predicts income from both education and age, uses the education values from column A and the age values from column B as known values.
The correlation between the actual income values in column C and those predicted by both education and age in column G is shown in cell J4 of Figure 4.18. This correlation, 0.80, is somewhat stronger than the correlation between income and income predicted by education (0.63) or income predicted by age (0.72). This means that, to the extent that this sample is representative of the population, you can make a more accurate income prediction when you use both education and age than when using either variable alone.