
Variance is one of the most useful tools in probability theory and statistics. In science, it describes how far each number in the dataset is from the mean. In practice, it often shows how much something changes. For example, the temperature near the equator has less variance than in other climate zones. In this section, we will analyze various methods to calculate variance in Excel.
What is Variance?
Variance is a measure of the variability of a data set that indicates how spread out the different values are.
Mathematically, variance is defined as the mean of the squared deviations from the mean.
To better understand what you’re actually calculating with variance, let’s consider this simple example:
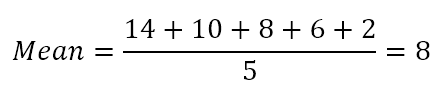
Suppose there are 5 tigers in your local zoo, aged 14, 10, 8, 6, and 2 years.
To find the variance, follow these simple steps:
- Calculate the mean (simple average) of the five numbers:
- Subtract the mean from each number to find the differences.
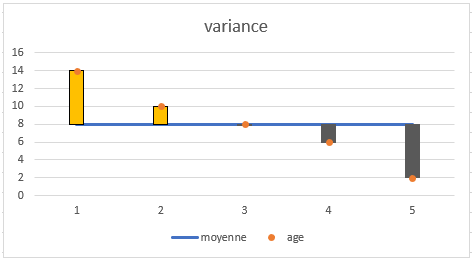
- Square each difference.
- Find the mean of the squared differences.

Thus, the variance is 16. But what does this number really mean?
In reality, variance gives you only a very general idea of the dispersion of the dataset. A value of 0 means there is no variability (i.e., all numbers in the dataset are the same). The larger the number, the more spread out the data is.
This example pertains to the population variance (i.e., the 5 tigers represent the entire group of interest). If your data is a selection from a larger population, you would need to calculate the sample variance using a slightly different formula.
How to Calculate Variance in Excel
There are 6 built-in functions in Excel to calculate variance: VAR(), VAR.S(), VARP(), VAR.P(), VARA(), and VARPA().
Your choice of variance formula depends on the following factors:
- The version of Excel you are using.
- Whether you are calculating sample or population variance.
- Whether you want to evaluate or ignore text and logical values.
Here’s an overview of the variance functions available in Excel to help you choose the formula that best suits your needs:
| Name | Excel Version | Data Type | Text & Logic Handling |
| VAR | 2000 – 2019 | Sample | Ignored |
| VAR.S | 2010 – 2019 | Sample | Ignored |
| VARA | 2000 – 2019 | Sample | Evaluated (TRUE=1, FALSE=0) |
| VARP | 2000 – 2019 | Population | Ignored |
| VAR.P | 2010 – 2019 | Population | Ignored |
| VARPA | 2000 – 2019 | Population | Evaluated (TRUE=1, FALSE=0) |
VAR.S() vs VARA() and VAR.P() vs VARPA()
The functions VARA() and VARPA() differ from the others in how they handle logical and text values in the references. Here’s a summary of how they treat textual representations of numbers and logical values:
| Argument Type | VAR(), VAR.S(), VAR.P(), VAR.P.N() | VARA() & VARPA() |
| Logical values in arrays & references | Ignored | Evaluated (TRUE=1, FALSE=0) |
| Textual representations of numbers | Ignored | Evaluated as zero |
| Logical values and textual representations in arguments | Evaluated (TRUE=1, FALSE=0) | – |
| Empty cells | Ignored | – |
How to Calculate Sample Variance
A sample is a set of data drawn from the entire population. Variance calculated from a sample is called sample variance.
For example, if you want to know how people’s heights vary, it would be technically impossible to measure every person on earth. The solution is to take a sample from the population, say 1,000 people, and estimate the overall population height based on this sample.
The sample variance is calculated using this formula:
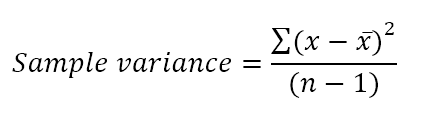
Where:
- xˉ is the mean (average) of the sample values.
- n is the sample size, i.e., the number of values in the sample.
There are 3 functions to find the sample variance in Excel: VAR(), VAR.S(), and VARA().
VAR() Function in Excel
This is the oldest function in Excel to estimate variance from a sample. It is available in all versions of Excel from 2000 to 2019.
Syntax:
=VAR(number1, [number2], …)
In Excel 2010, the VAR() function was replaced by VAR.S() for improved accuracy. While VAR() is still available for backward compatibility, it is recommended to use VAR.S() in current versions of Excel.
VAR.S() Function in Excel
This is the modern equivalent of the VAR() function. Use VAR.S() to find the sample variance in Excel 2010 and later versions.
Syntax:
=VAR.S(number1, [number2], …)
VARA() Function in Excel
The VARA() function returns the sample variance based on a range of numbers, text, and logical values, as shown in the table earlier.
Syntax:
=VARA(value1, [value2], …)
Example Variance Formula
When working with a set of numerical data, you can use any of the above functions to calculate the sample variance in Excel.
For example, let’s find the variance of a sample consisting of 5 values (B2:B6). You can use one of these formulas:
- =VAR(B2:B6)
- =VAR.S(B2:B6)
- =VARA(B2:B6)
As shown in the screenshot, all formulas return the same result (rounded to 2 decimal places).
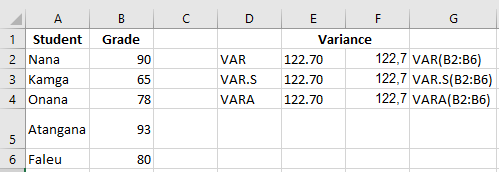
To verify the result, let’s calculate the variance manually:
- Find the mean using the AVERAGE() function:
=AVERAGE(B2:B6)
The mean goes to any empty cell, say B7. - Subtract the mean from each number in the sample:
=B2-$B$7
The differences go into column C, starting from C2. - Square each difference and place the results in column D, starting from D2:
=C2^2 - Sum the squared differences and divide by the number of elements in the sample minus 1:
=SUM(D2:D6)/(5-1)
As you can see, the result of our manual variance calculation matches exactly with the number returned by the built-in Excel functions.
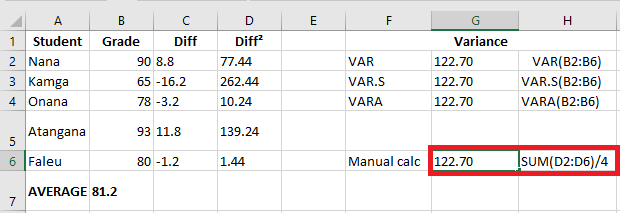
If your dataset contains Boolean and/or textual values, the VARA() function will return a different result. The reason is that VAR() and VAR.S() ignore any values other than numbers in the references, while VARA() evaluates text values as zero, TRUE as 1, and FALSE as 0. Therefore, carefully choose the variance function based on whether you want to handle or ignore text and logical values.
How to Calculate Population Variance
The population refers to the entire set of observations in the area of study. The population variance describes the spread of data points in the entire population.
Population variance can be found using this formula:
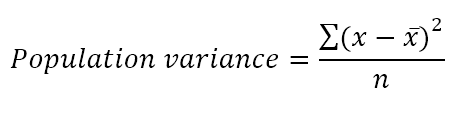
Where:
- x¯ is the population mean.
- n is the population size, i.e., the total number of values in the population.
There are 3 functions to calculate the population variance in Excel: VAR.P(), VAR.P.N(), and VARPA().
VAR.P() Function in Excel
The VARP() function returns the variance of a population based on the complete set of numbers. It is available in all versions of Excel from 2000 to 2019.
Syntax:
=VAR.P(number1, [number2], …)
In Excel 2010, VARP() was replaced by VAR.P(), but it’s still kept for backward compatibility. It is recommended to use VAR.P() in current versions of Excel since there’s no guarantee that VARP() will be available in future versions.
VAR.P.N() Function in Excel
This is an enhanced version of the VAR.P() function available in Excel 2010 and later versions.
Syntax:
=VAR.P.N(number1, [number2], …)
VARPA() Function in Excel
The VARPA() function calculates the variance of a population based on the complete set of numbers, text, and logical values.
Syntax:
=VARPA(value1, [value2], …)
Example Population Variance Formula
In the example where we calculated the sample variance, we had 5 exam scores, assuming they were a selection from a larger group of students. If you collect data on all the students in the group, these data will represent the entire population, and you’ll calculate population variance using the functions above.
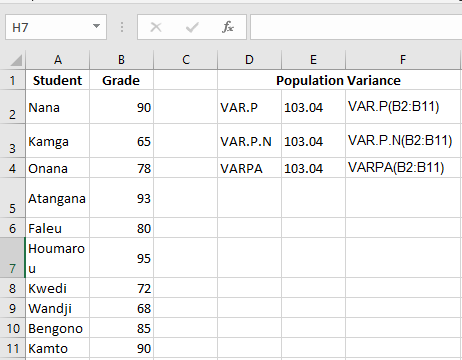
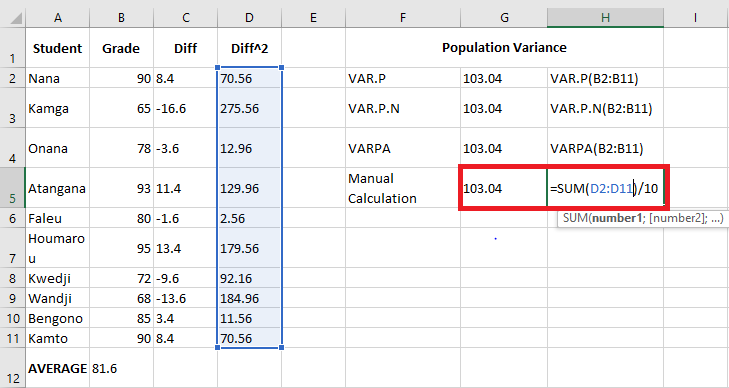
Let’s say we have the exam scores of a group of 10 students (B2:B11). The scores represent the population, so we’ll calculate the population variance using these formulas:
- =VAR.P(B2:B11)
- =VAR.P.N(B2:B11)
- =VARPA(B2:B11)
All formulas will return the identical result.
Variance Formula in Excel – Notes on Usage
To perform variance analysis correctly in Excel, please follow these simple rules:
- Provide arguments as values, arrays, or cell references.
- In Excel 2007 and later versions, you can provide up to 255 arguments for a sample or population; in Excel 2003 and earlier versions, up to 30 arguments.
- To evaluate only numbers in references, ignoring empty cells, text, and logical values, use VAR() or VAR.S() for sample variance and VAR.P() or VAR.P.N() for population variance.
- To evaluate logical and text values in references, use VARA() or VARPA().
- Provide at least two numerical values for a sample variance formula and at least one numerical value for a population variance formula in Excel, or you will get a #DIV/0! error.
- Arguments containing text that cannot be interpreted as numbers will cause #VALUE! errors.
Variance is undoubtedly a useful concept in science, but it provides very little practical information. For example, we found the ages of the tiger population in a zoo and calculated the variance, which equals 16. The question is: how can we really use this number?
You can use variance to calculate the standard deviation, which is a much better measure of the amount of variation in a dataset. The standard deviation is calculated as the square root of the variance. So, taking the square root of 16 gives a standard deviation of 4.
When combined with the mean, the standard deviation can tell you the age of most of the tigers. For example, if the mean is 8 and the standard deviation is 4, most of the tigers in the zoo are between 4 years (8 – 4) and 12 years (8 + 4).