A chart is a visual representation of numerical values. Charts are an integral part of spreadsheets. The charts generated by early spreadsheet programs were fairly basic, but they have improved significantly over the years. Excel provides you with the tools to create a wide variety of highly customizable, professional-quality charts.
Displaying data in a well-designed chart can make your numbers much easier to understand. Because a chart presents a visual image, charts are especially useful for summarizing a series of numbers and their relationships. Creating a chart can often help you spot trends and patterns that might otherwise go unnoticed.
The following figure shows a worksheet that contains a simple column chart representing a company’s monthly sales volume.
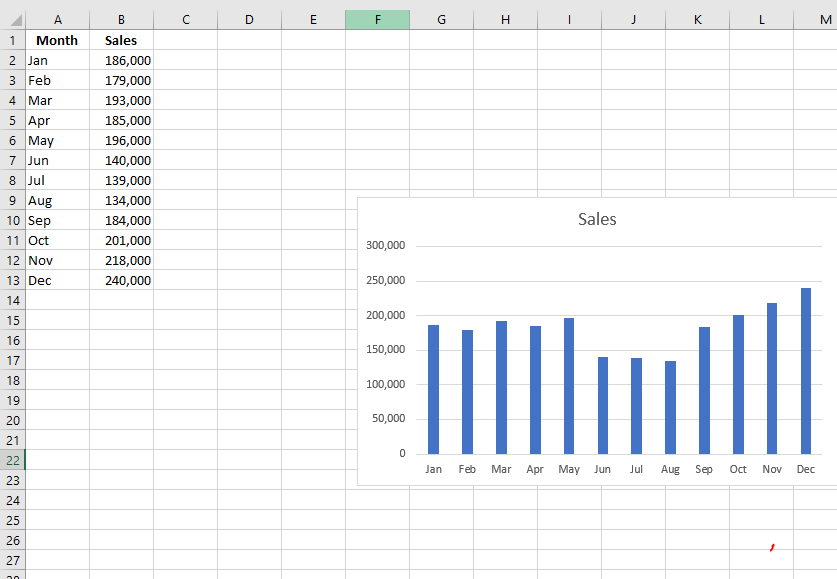
A quick glance at the chart clearly reveals that sales dropped during the summer months (June through August), but steadily increased over the last four months of the year. Of course, you could reach the same conclusion simply by studying the numbers. However, visualizing the data through a chart conveys the point much more quickly.
A simple column chart represents monthly sales volume.