Enabling and Disabling a Chart Series
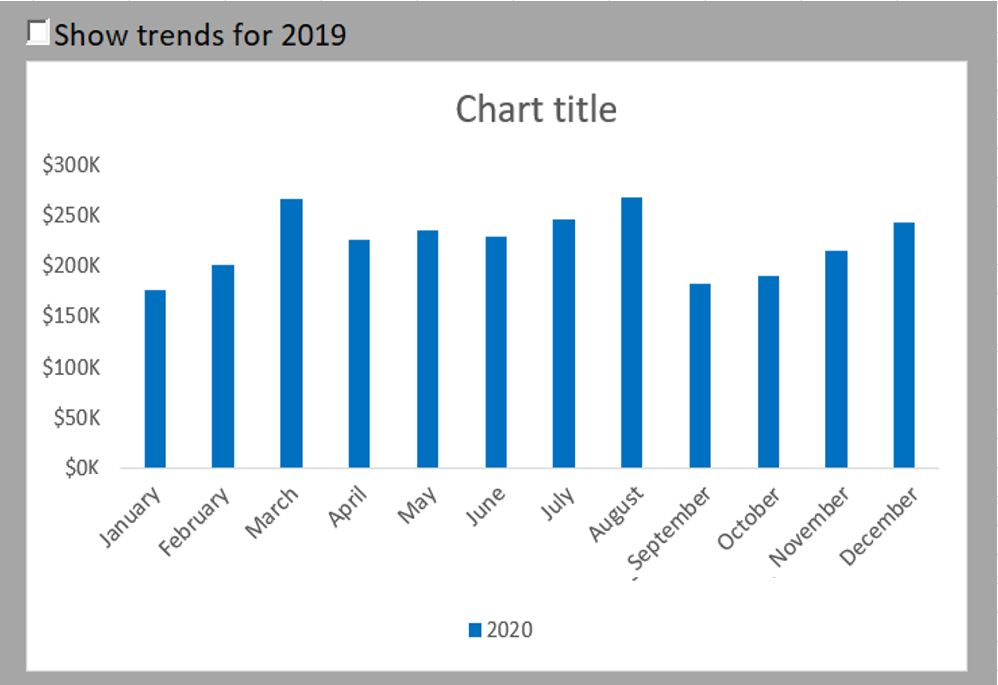
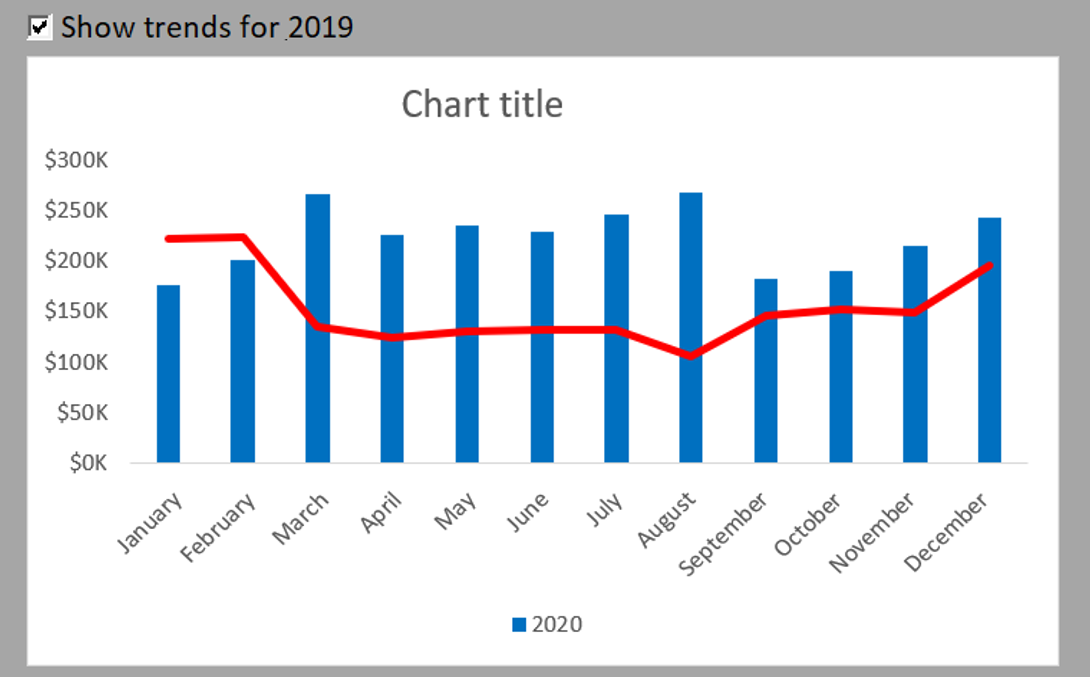
The following figure shows the same chart twice. Notice that the top chart contains a single series, with a checkbox offering to display 2019 trend data. The bottom chart shows the same chart with the checkbox selected.
A checkbox can help create the effect of disappearing data series.
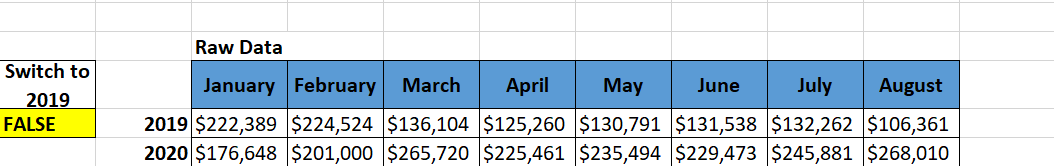
You start with the raw data that contains both 2019 and 2020 data; see the following figure. The Check Box control will display its value (TRUE or FALSE) in cell A12.
Next, create the analysis layer (staging table) consisting of all the formulas, as shown in the following figure. The chart is bound to the data in the staging table, not the raw data. This way, you can control what the chart sees.
Start with the raw data and a cell where a Check Box control can output its value.
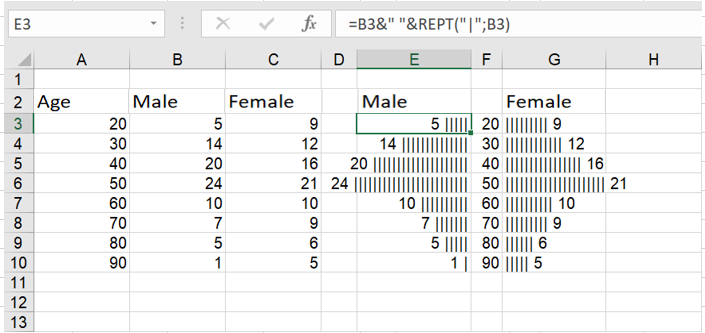
Transfer table that will populate the graph. The values of this data are all formulas.
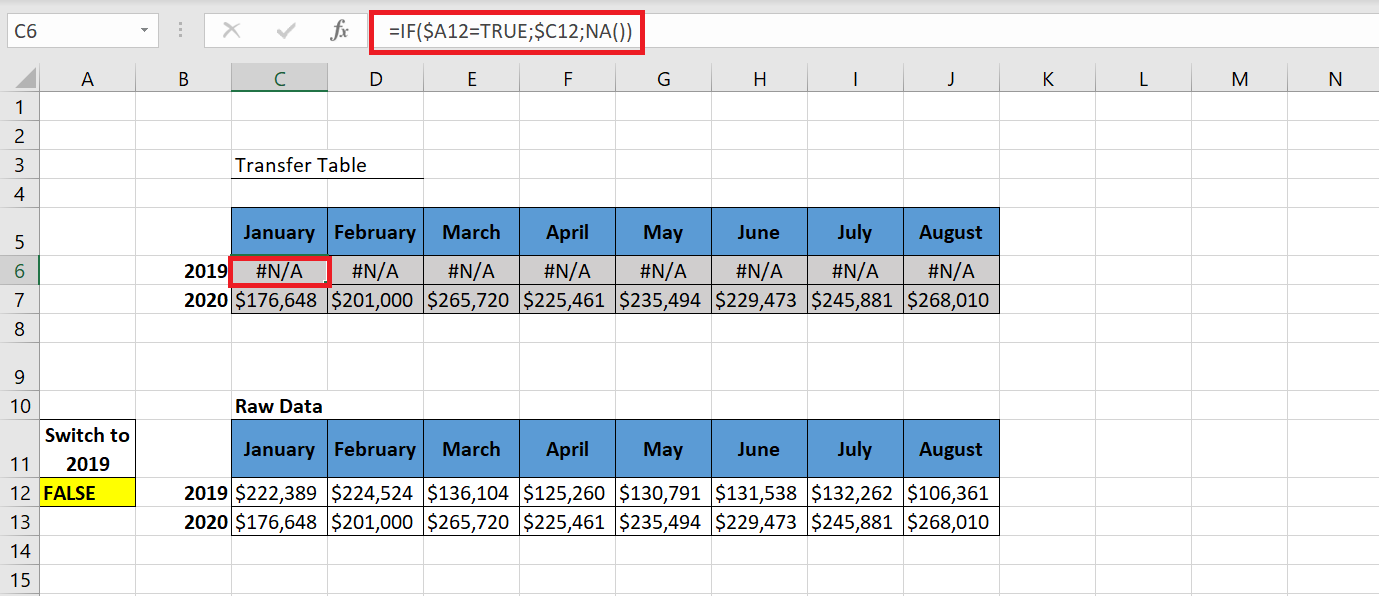
As you can see in the previous figure, the formulas for the 2020 row simply reference the raw data cells for each respective month. You do this because you want the 2020 data to appear at all times.
For row 2019, test the value in cell A12 (the cell containing the checkbox output). If A12 reads TRUE, you are referencing the respective 2019 cell in the raw data. If A12 does not read TRUE, the formula uses Excel’s NA() function to return a #N/A error. Excel charts cannot read a cell with the #N/A error. Therefore, they simply do not show data series for cells that contain #N/A. This is ideal when you do not want a data series to be displayed.
Note that the formula shown in the previous figure uses an absolute reference with cell A12, that is, the reference to cell A12 in the formula is prefixed with a $ sign ($A12). This ensures that column references in formulas do not change when they are copied.
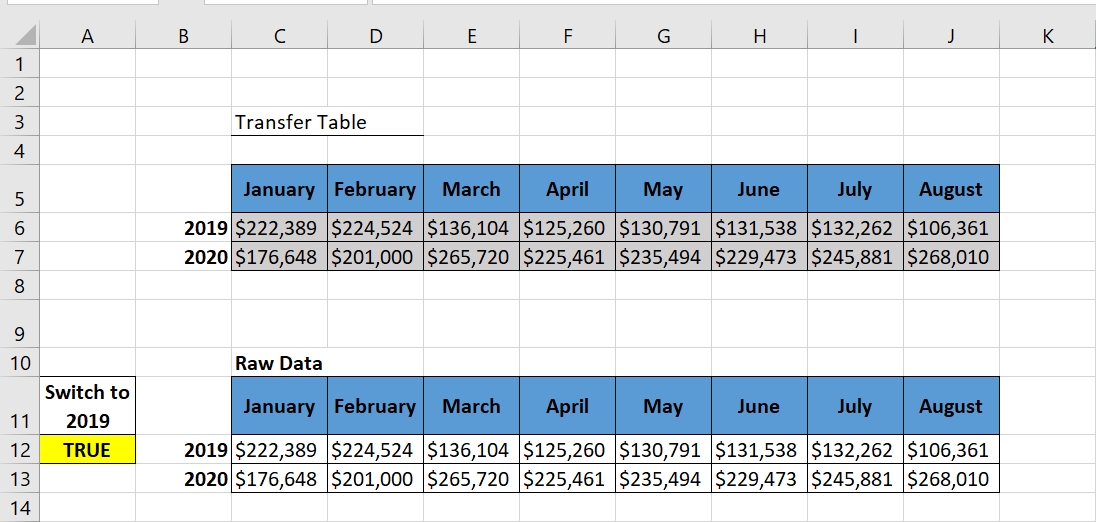
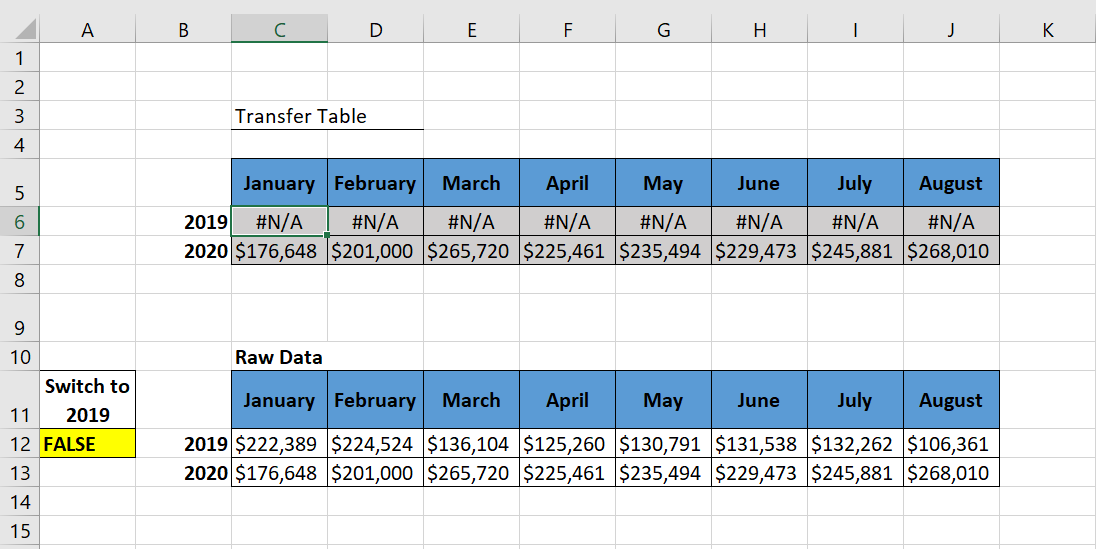
The following figure illustrates both scenarios in action in the staging table. In the scenario shown at the bottom of the following figure, cell A12 is set to TRUE, so the staging table actually brings in data for 2019. In the scenario shown at the top of the following figure, cell A12 is set to FALSE, so the staging table returns #N/A for 2019.
When cell A12 reads TRUE, 2019 data is displayed; when it reads FALSE, the 2019 row only displays #N/A errors.
F inally, to create the graph that we saw previously at the beginning of this section, we will follow the following steps:
1 Select the data range of the transfer table (B5 :J7 ), in the Insert tab of the ribbon, select Insert Histogram .
2 Perform the following formatting
- Select the 2019 legend and delete it because the data is hidden ;
- Select the Main Grid and delete it;
- Select the data series, change its color to blue and increase the Range Width.
- Right-click on the vertical axis and select Format Axis . In the Format Axis dialog box that appears, in the Number category , select « $ »# ##0 k
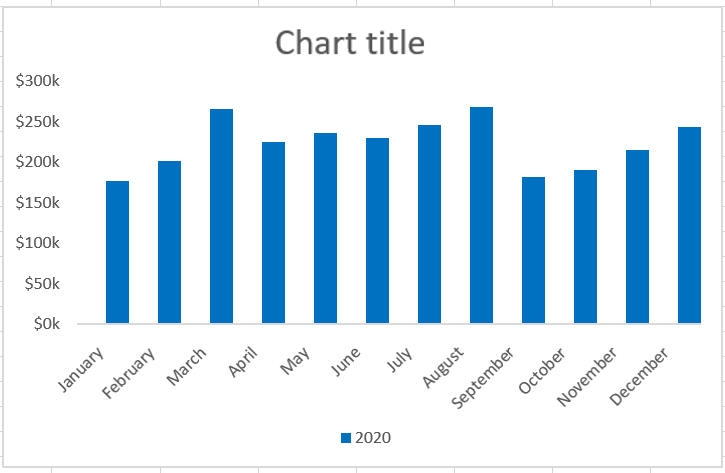
Now the histogram looks like the following figure
3 Click Insert on the Developer tab of the ribbon and select the Check Box form control .
4 Proceed as follows to customize the checkbox:
- Right-click the Checkbox and select Edit Text to rename it to Show 2019 Trends .
- Right-click the checkbox control and select Format Control. In the dialog box that appears, enter $A$12 in the Linked Cell box . In the dialog box, select 3D Shading to make the checkbox control more visible.
Now, when you check the checkbox control , the 2019 trend chart appears as a histogram.
5 To change the chart type to 2019 trend chart, right-click on the chart and select Change Chart Type Data Series . A dialog box will appear where you will change the chart type as shown in the following figure and click OK.
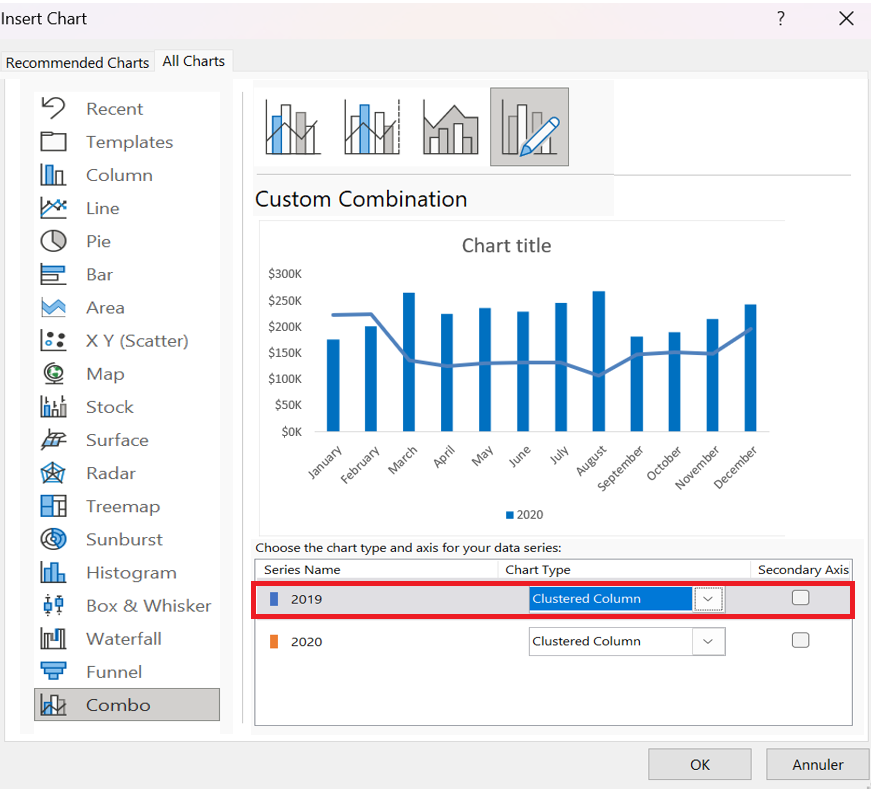
6 Finally, right-click on the 2019 trend chart and select
Format Data Series to change the color.