Editing chart data with a drop-down list
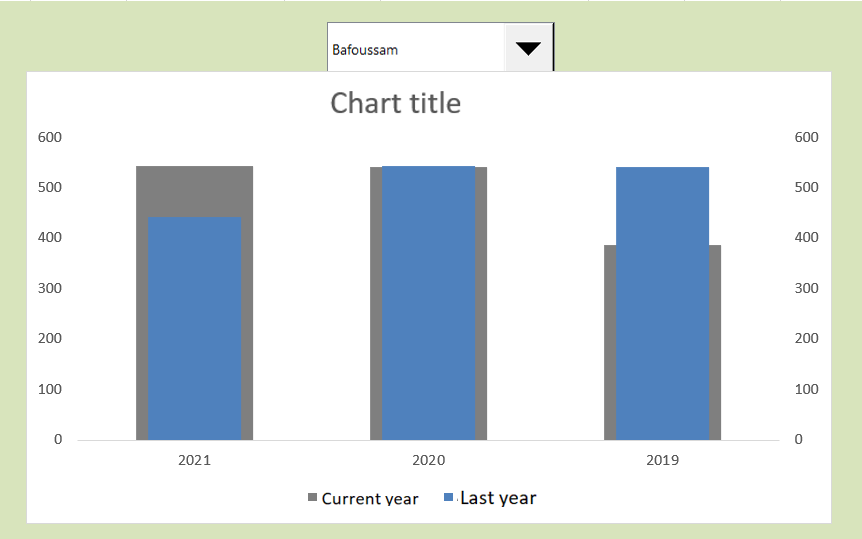
drop-down controls to give your users an intuitive way to select data via a drop-down selector. The following figure shows a thermometer chart controlled by the drop-down list above. When a user selects the Maroua market, the chart responds by plotting the data for the selected market.
Use drop-down lists to give your users an intuitive drop-down selector.
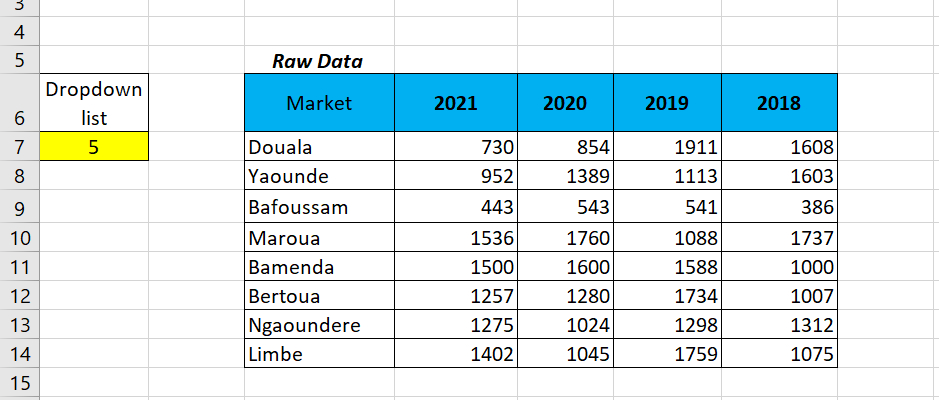
To create this example, start with the raw dataset shown in the following figure. This dataset contains the data for each market. Near the raw data, reserve cell A7 where the drop-down list will display its value. This cell detects the index number of the selected drop-down list entry.
Raw data set and cell in which the drop-down list can display its value.
You then create the analysis layer (the staging table) consisting of all the formulas, as shown in the following figure. The chart is linked to this staging table, allowing you to control what the chart sees. The first cell of the staging table contains the following INDEX formula:
=INDEX(D7:D14,$A$7)
Create a staging table using the INDEX function to extract the appropriate data from the raw dataset.
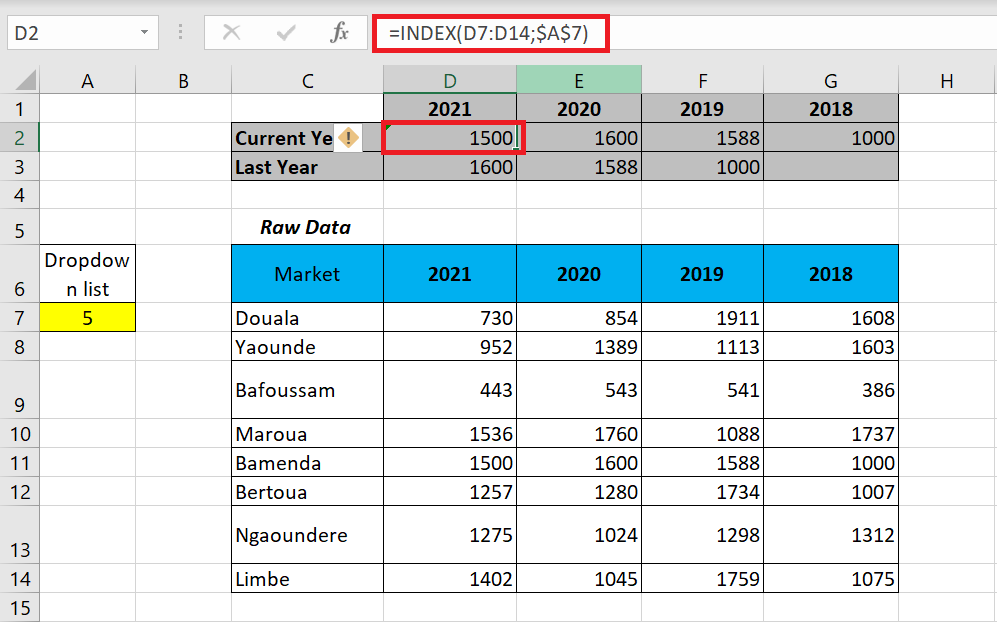
The INDEX function converts an index number into a recognizable value. An INDEX function requires two arguments to work properly. The first argument is the range of the list you are working with. The second argument is the index number.
In this example, you use the index number of the combo box (in cell A7) and extract the value from the appropriate range (2021 data in A7 : A14). Again, note the use of absolute dollar signs ($). This ensures that cell references in formulas don’t change when copied and traversed.
Look at the previous figure to see what happens. The INDEX formula in cell D2 points to the range containing the 2021 data. It then captures the index number in cell A7 (which intercepts the output value of the drop-down list). The index number happens to be 7. So, the formula in cell P2 will extract the seventh value from the 2021 data range (Ngaoundéré).
When you copy the formula, Excel adjusts the formula to extract the seventh value from each year’s data range. Once your INDEX formulas are in place, you have a clean staging table that you can use to create your chart.