How to manage missing data?
Often, some rows in a spreadsheet contain missing data. Excel offers three ways to graphically represent missing data:
■ Display data as zeros.
■ Display data as blanks (gaps).
■ Replace a missing data point with a line joining adjacent data points.
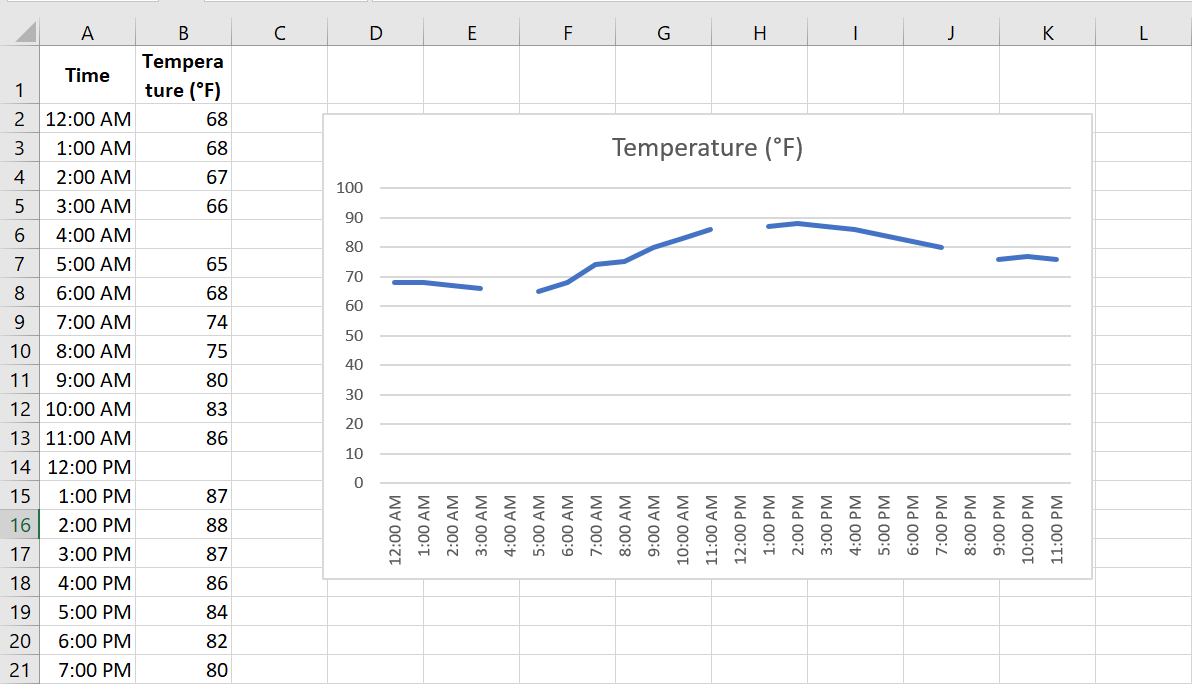
Missing Data worksheet contains hourly temperatures, but several values are missing. After plotting the data as a line chart, right-click the data and choose Select Data . This opens the dialog box shown in the following figure.
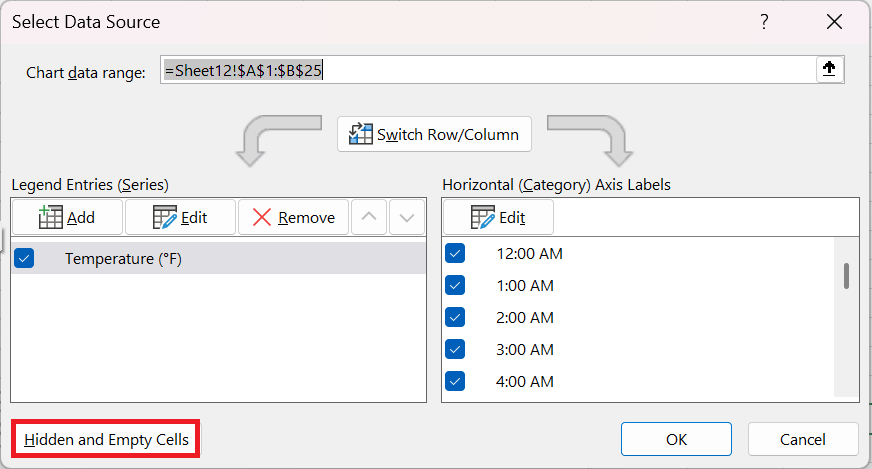
In this dialog box, click Hidden Cells and Empty Cells. A new dialog box appears, as shown in the following figure
This figure shows the Cell Settings dialog box hidden and empty.
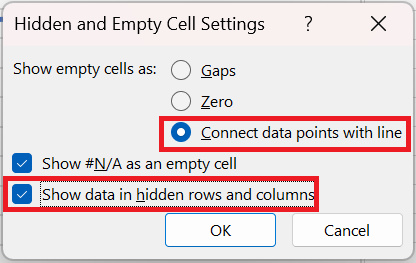
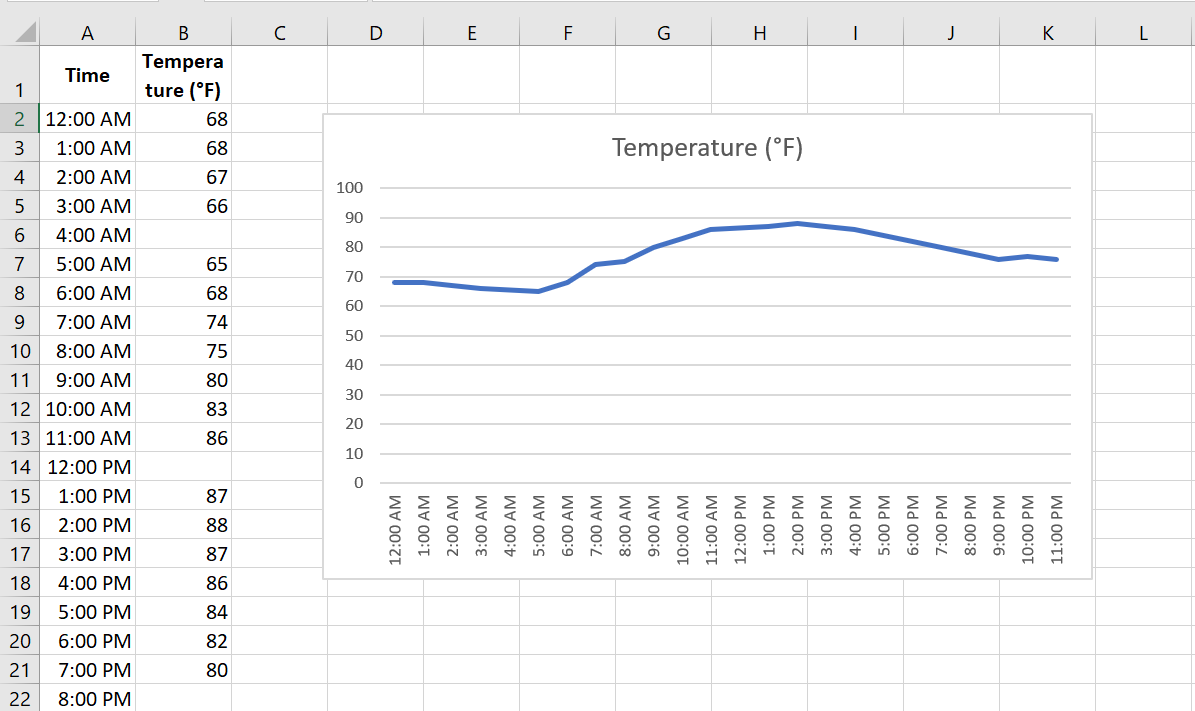
After selecting Connect data points with a line , you get the chart shown in the following figure. Choose the line chart with points and lines so that you can select the missing data, because missing data points do not have markers.
Missing data is replaced with rows.