Manage the appearance of hidden data
Often, we plot data such as daily sales and filter the data in the worksheet. In this situation, Excel gives you the choice to continue displaying all the data in the chart or just display the filtered data. The hidden data worksheet contains the daily sales of a product for one year. If you represent the data as a line graph, you see the graph shown in the following figure. If you right-click the data and select Show data in hidden rows and columns , shown in the following figure, even if you filter the data, all the data points will still be displayed in the chart.
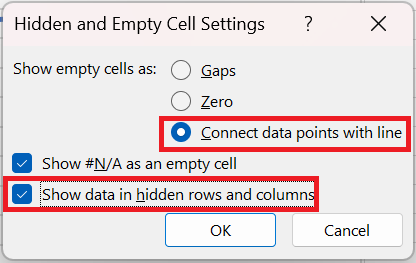
For example, as shown in the following figure , the data is filtered to show only December sales, but the chart still displays all daily sales for the entire year. If you did not select Show data in hidden rows and columns, only December sales would be visible in the chart.
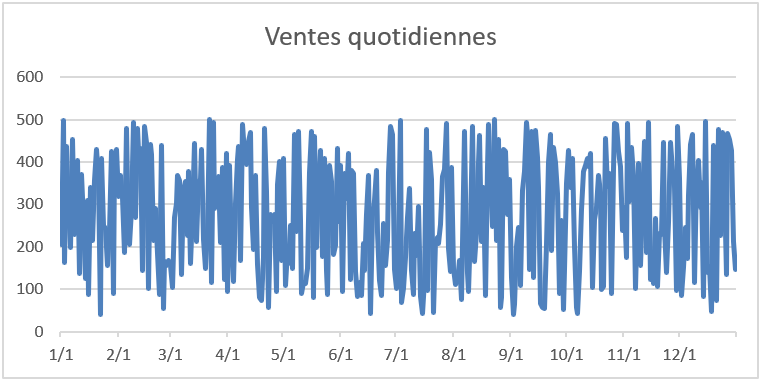
FIGURE 52-9 This is a graph showing daily product sales.
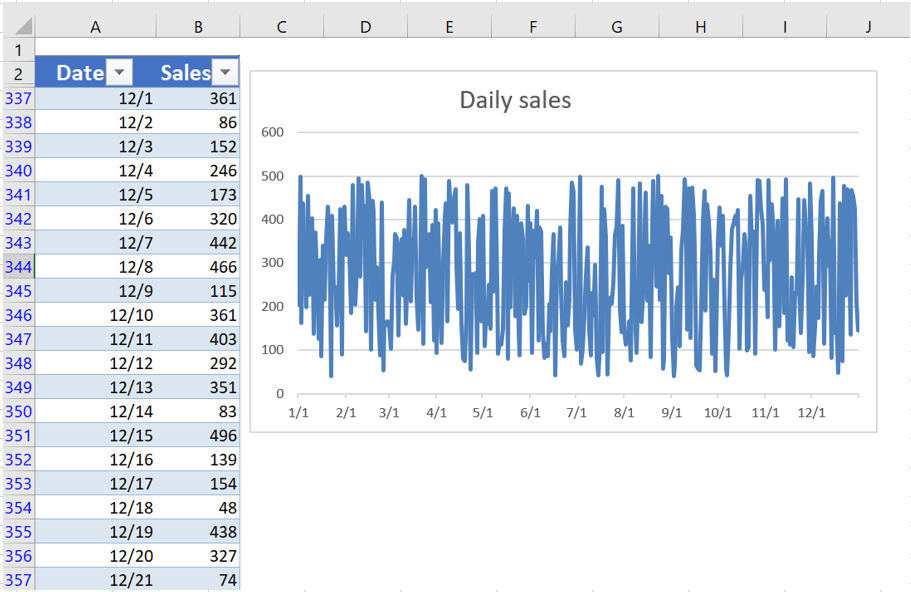
The data is filtered, but not the graph.