Place data labels on a chart based on cell contents
Place Data Labels worksheet .
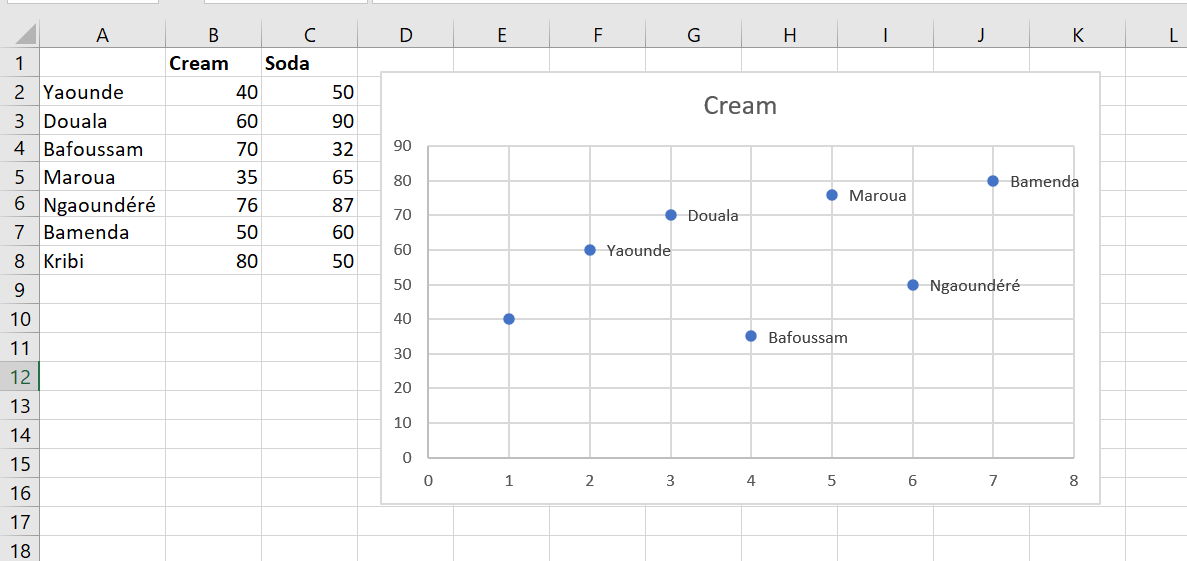
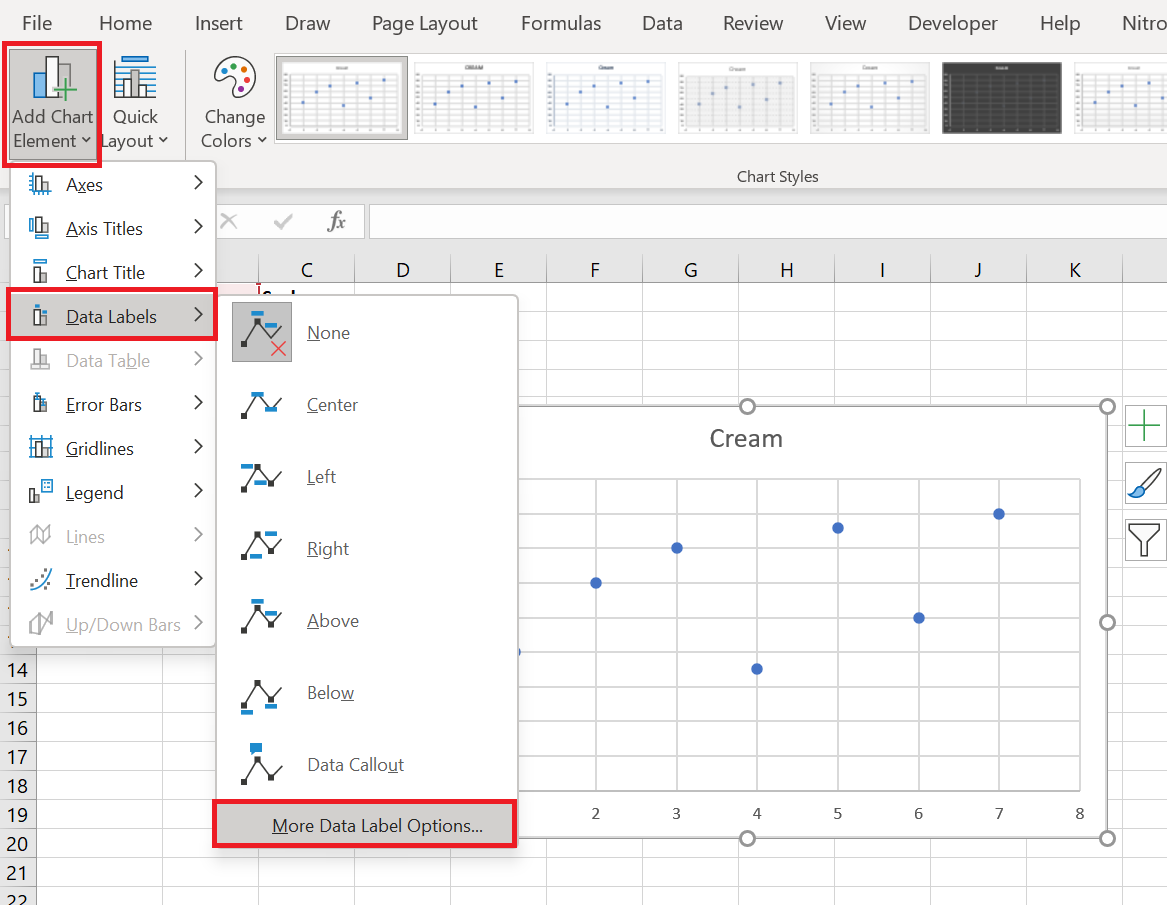
To begin creating this chart, select the cell range B1 : C8 and choose the first scatter plot choice on the Insert tab. (The scatter plot is the icon with dots next to the pie chart.) This creates the scatter plot of the figure without the city labels. To create the city labels, select the chart. On the Design tab , select Add Chart Element , choose Data Labels , and then More Data Label Options , as shown in the following figure.
In the dialog box that appears, check Value from cells and uncheck Y Value as shown in the following figure. 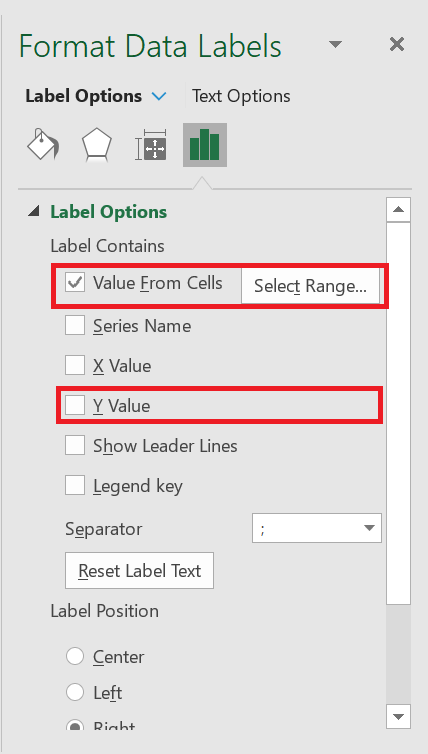
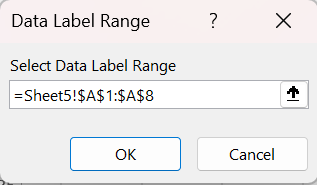
Now you can select the cell range A2 : A8 to insert the city labels into the chart as shown in the following figure.