Votre panier est actuellement vide !
Catégorie : Uncategorized
SOME TYPES OF GRAPHICS
SOME TYPES OF GRAPHICS
A common question among Excel users is « How do I know what type of chart to use for my data? » Unfortunately, this question doesn’t have a clear answer. Perhaps the best answer is vague: use the type of chart that most simply gets your message across. Excel’s recommended charts are a good starting point. Select your data and choose Insert Charts / Recommended Charts to see the chart types Excel suggests. Keep in mind that these suggestions aren’t always the best choices.
On the ribbon, the Charts group on the Insert tab displays the Recommended Charts button, along with nine other drop-down buttons. Each of these drop-down buttons displays multiple chart types. For example, column and bar charts are all available from a single drop-down button. Similarly, scatter and bubble charts share a single button. The easiest way to choose a particular chart type is probably to select Insert / Charts / Recommended Charts, which displays the Insert Chart dialog box. Select the All Charts tab , and you’ll get a concise list of all chart types and chart subtypes.
1 Column charts
Perhaps the most common chart type is the column chart, which displays each data point as a vertical column, the height of which corresponds to the value. The value scale is displayed on the vertical axis, which is usually on the left side of the chart. You can specify any number of data series, and the corresponding data points in each series can be stacked on top of each other. Typically, each data series is represented in a different color or pattern.
Column charts are often used to compare discrete items and can represent the differences between items in a series or items in multiple series. Excel offers seven types of sub-histograms.
The following figure shows an example of a clustered column chart that represents the monthly sales of two products.
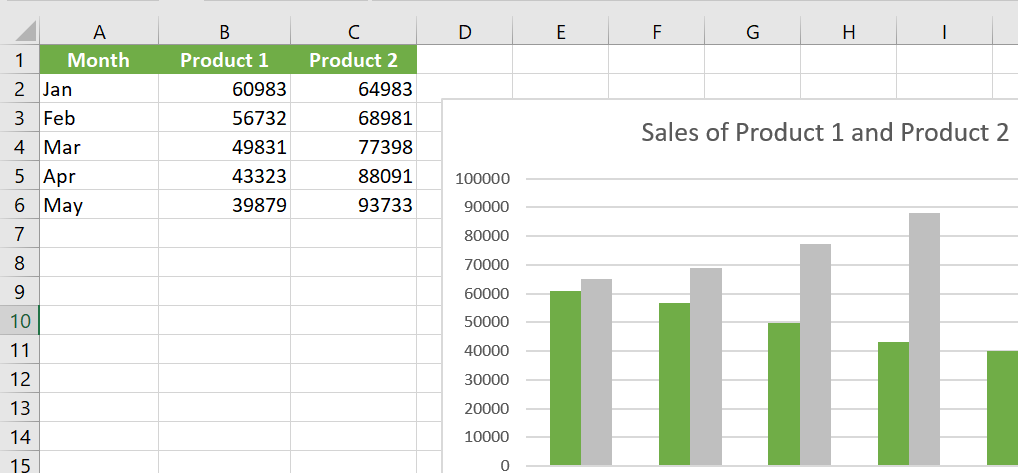
From this graph, it is clear that sales of Product 1 have always exceeded sales of Product 2. Moreover, sales of Product 2 have decreased over the five-month period, while sales of Product 1 are increasing.
The same data, in the form of a stacked column chart, is shown in the following figure.
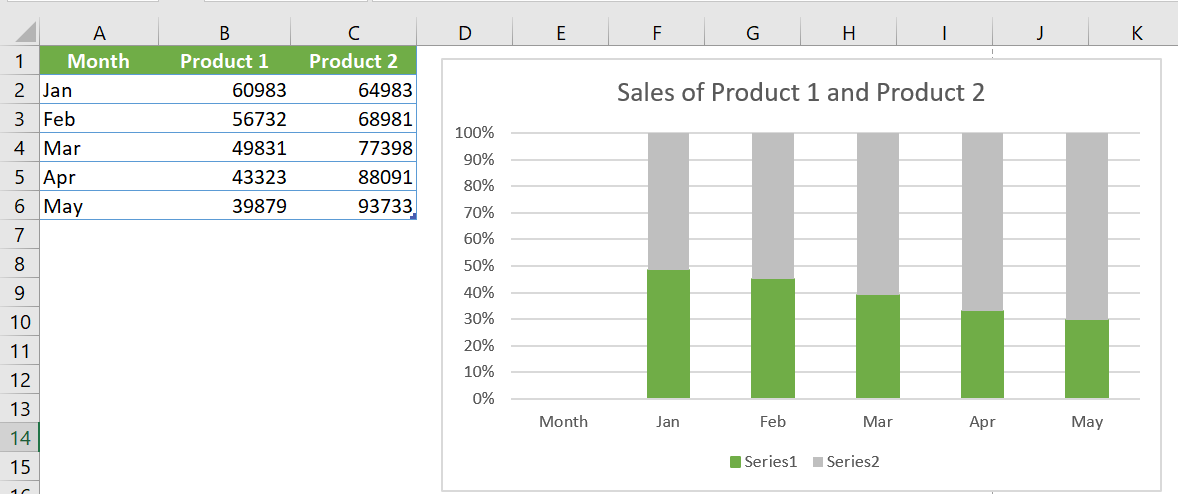
This graph has the added benefit of representing combined sales over time. It shows that total sales have remained fairly stable each month, but the relative proportions of the two products have changed.
This stacked column chart displays sales by product and represents total sales.
The following figure shows the same sales data plotted as a 100% stacked column chart.
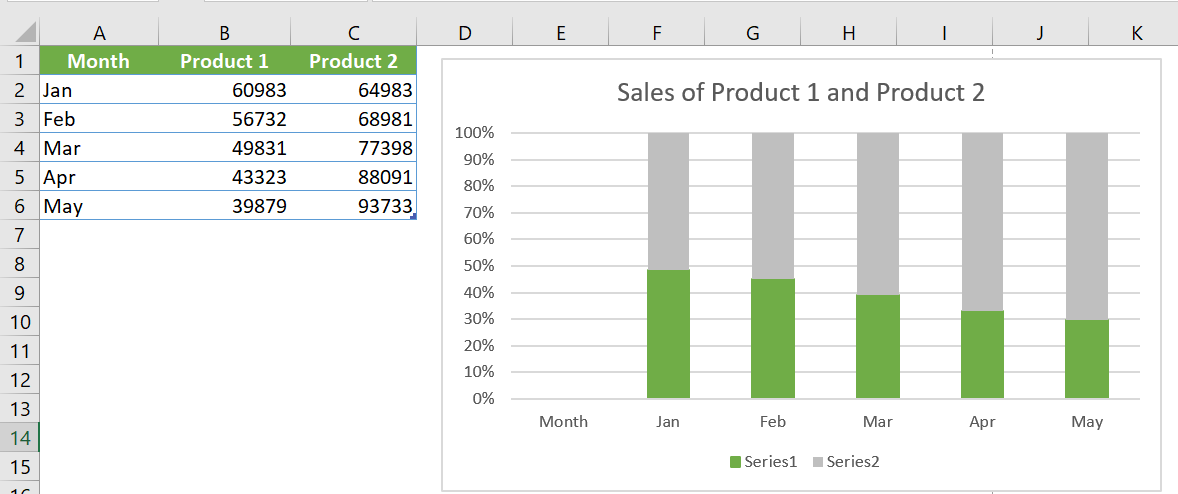
This type of chart shows the relative contribution of each product by month. Note that the vertical axis displays percentage values, not sales amounts. This chart does not provide any information about actual sales volumes, but this information could be provided using data labels. This type of chart is often a good alternative to using multiple pie charts. Instead of using a sector to show the relative sales volume each year, the chart uses a column for each year.
The data is plotted using a 3D clustered column chart in the following figure.
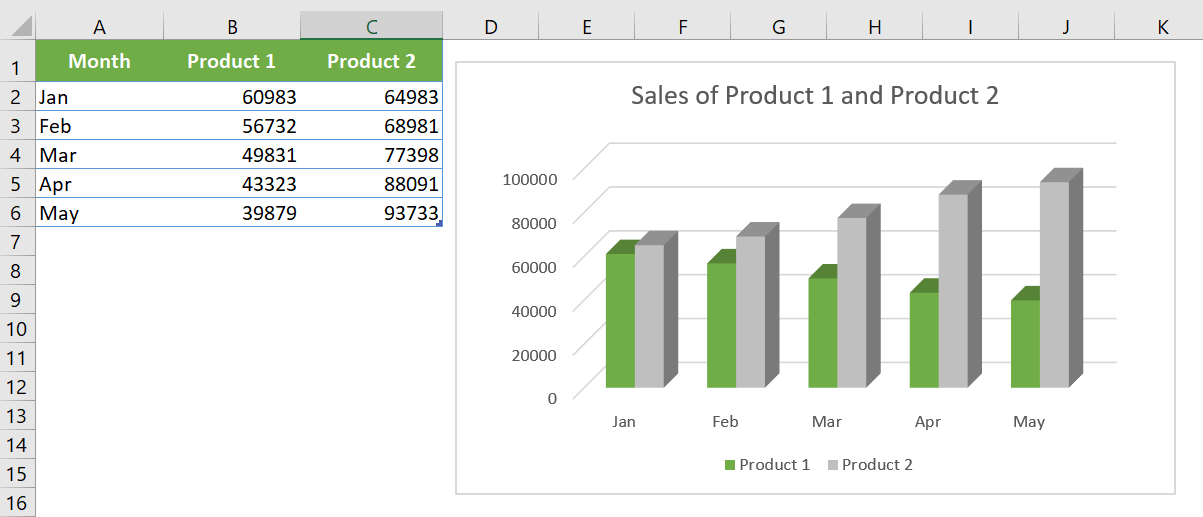
The name is a bit misleading because the chart only uses two dimensions, not three. Many people use this type of chart because it has more visual pizzazz. Compare this chart with a « true » 3D column chart (which has a second category axis), shown in the following figure.
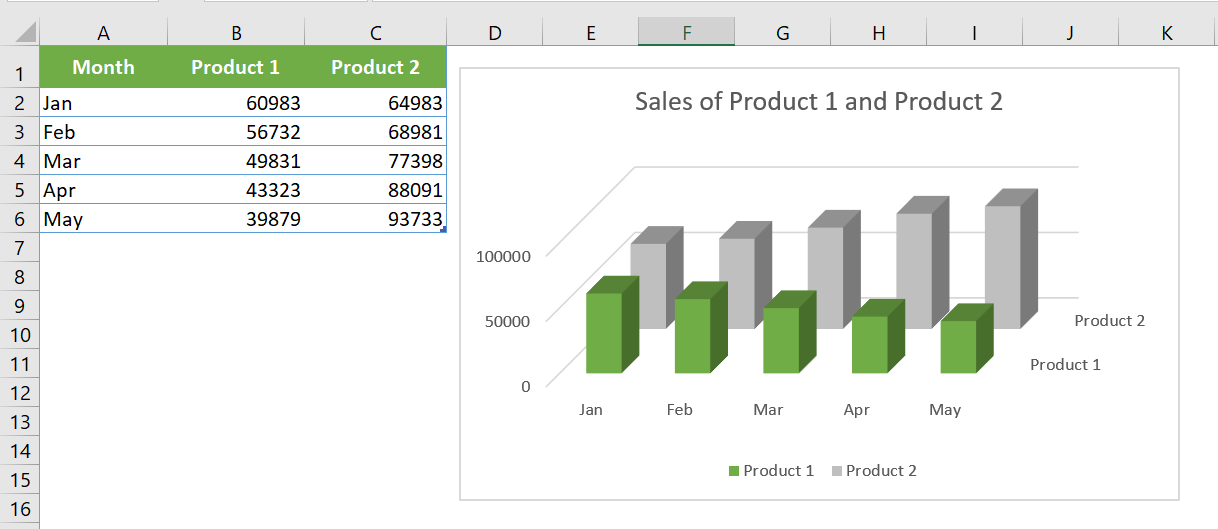
This type of chart can be visually appealing, but accurate comparisons are difficult due to the distorted perspective view.
For 3D columns, you can choose a different column shape in the Format Data Series dialog box. Excel offers variations such as cylinder, cone, and pyramid.
2 Bar charts
A bar chart is essentially a column chart that has been rotated 90 degrees clockwise. A distinct advantage of using a bar chart is that the category labels can be easier to read. The following figure shows a bar chart that displays a value for each of the ten survey items.
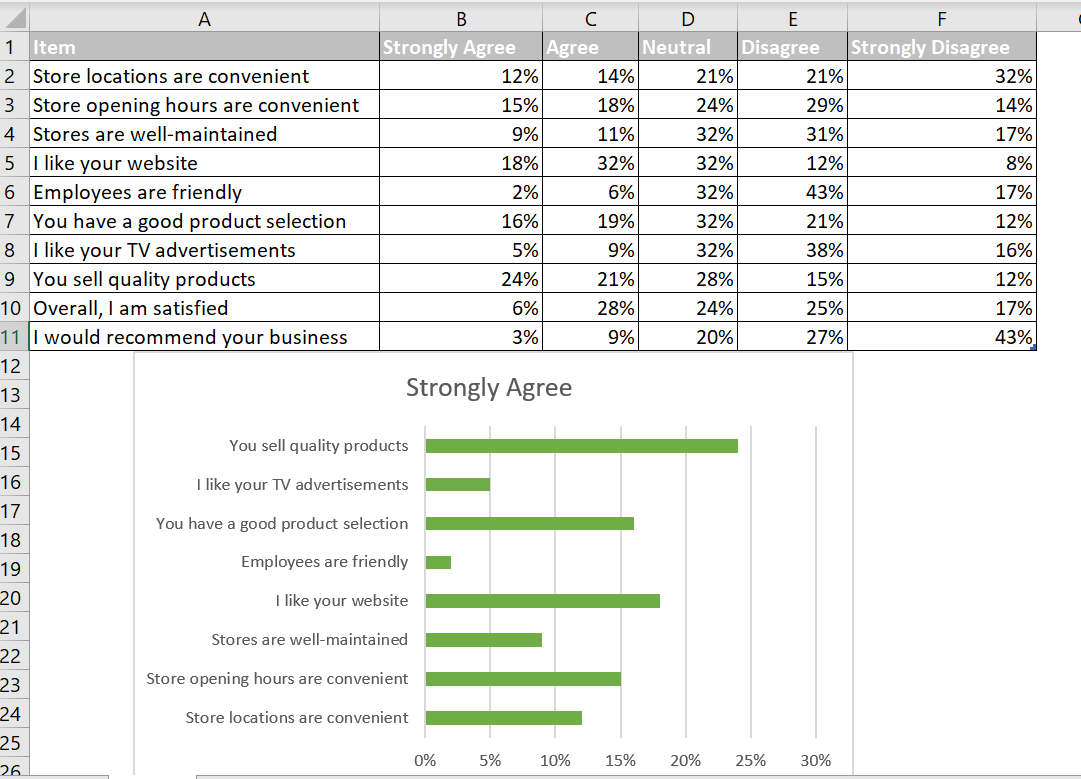
Category labels are long and would be difficult to display legibly with a histogram. Excel offers six subtypes of bar charts.
Unlike a histogram, no subtype displays multiple series along a third axis. (That is, Excel doesn’t provide a 3D bar chart subtype.) You can add a 3D look to a bar chart, but it will be limited to two axes.
You can include any number of data series in a bar chart. Additionally, bars can be « stacked » from left to right.
3 Line graphs
Line charts are often used to plot continuous data and are useful for identifying trends. For example, plotting daily sales as a line chart can help you identify fluctuations in sales over time. Typically, the x-axis of a line chart displays equal intervals. Excel supports seven subtypes of line charts.
See the following figure for an example of a line chart that represents monthly data (676 data points).
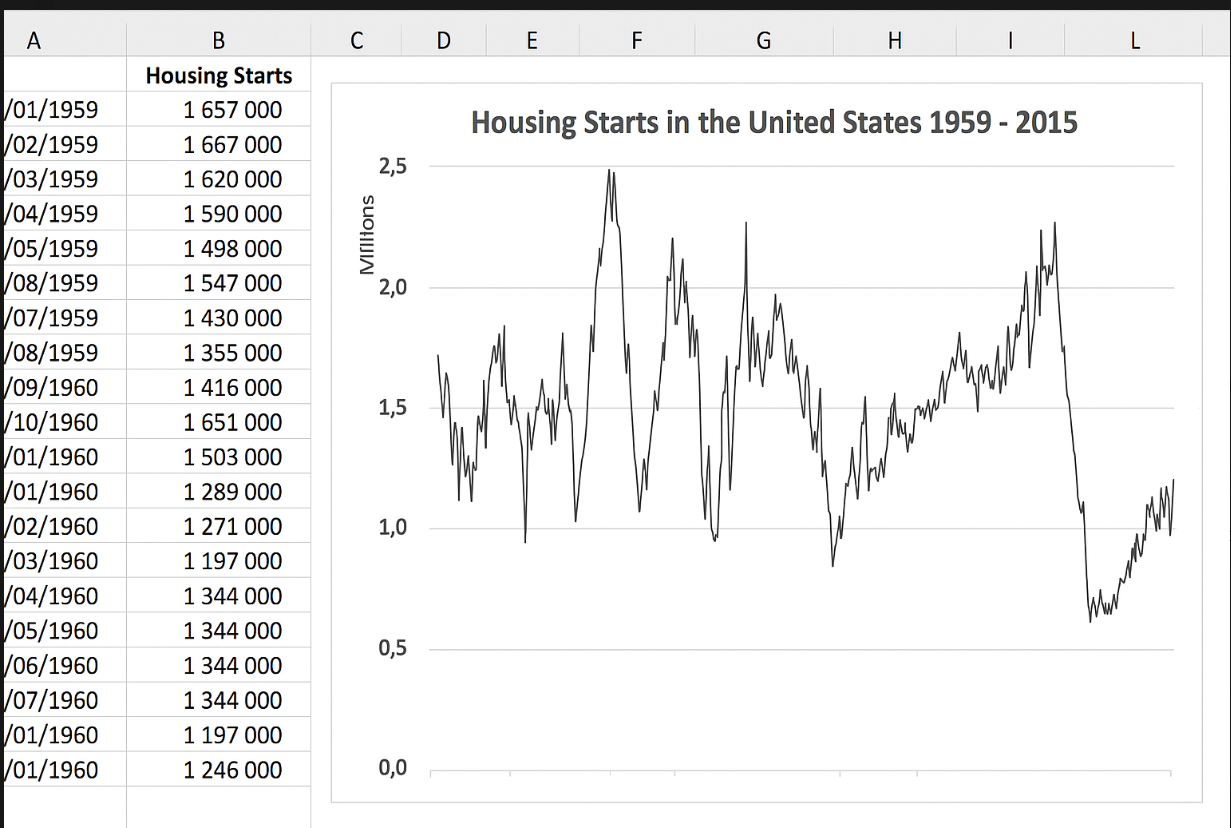
Although the data varies greatly from month to month, the graph clearly depicts the cycles.
A line chart can use any number of data series, and you distinguish the lines by using different colors, line styles, or markers. The following figure shows a line chart with three series.
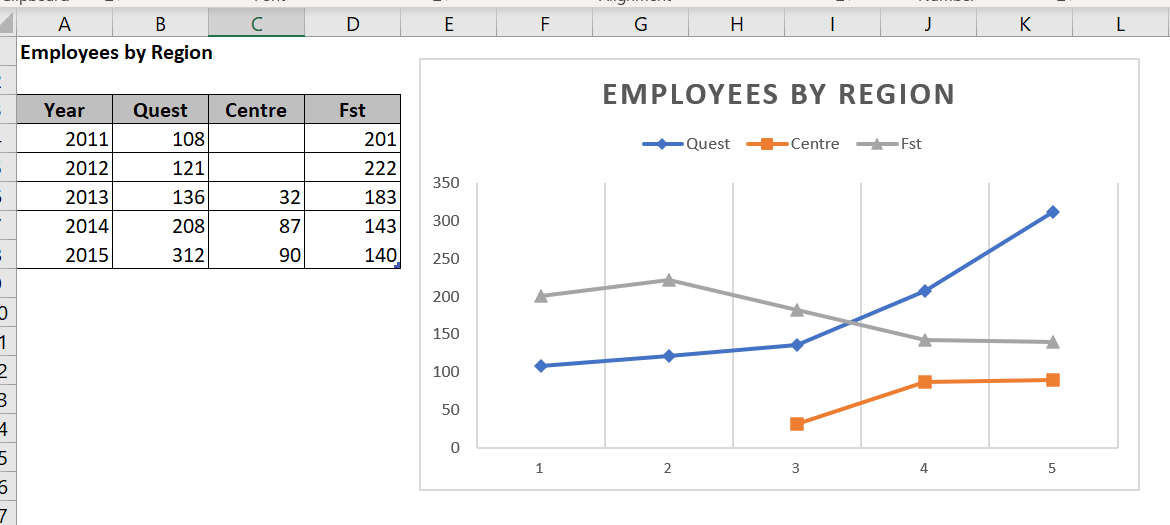
The series are distinguished by markers (circles, squares, and triangles) and different line colors. When the chart is printed on a non-color printer, the markers are the only way to identify the lines.
The last line chart example, shown in the following figure, is a 3D line chart.
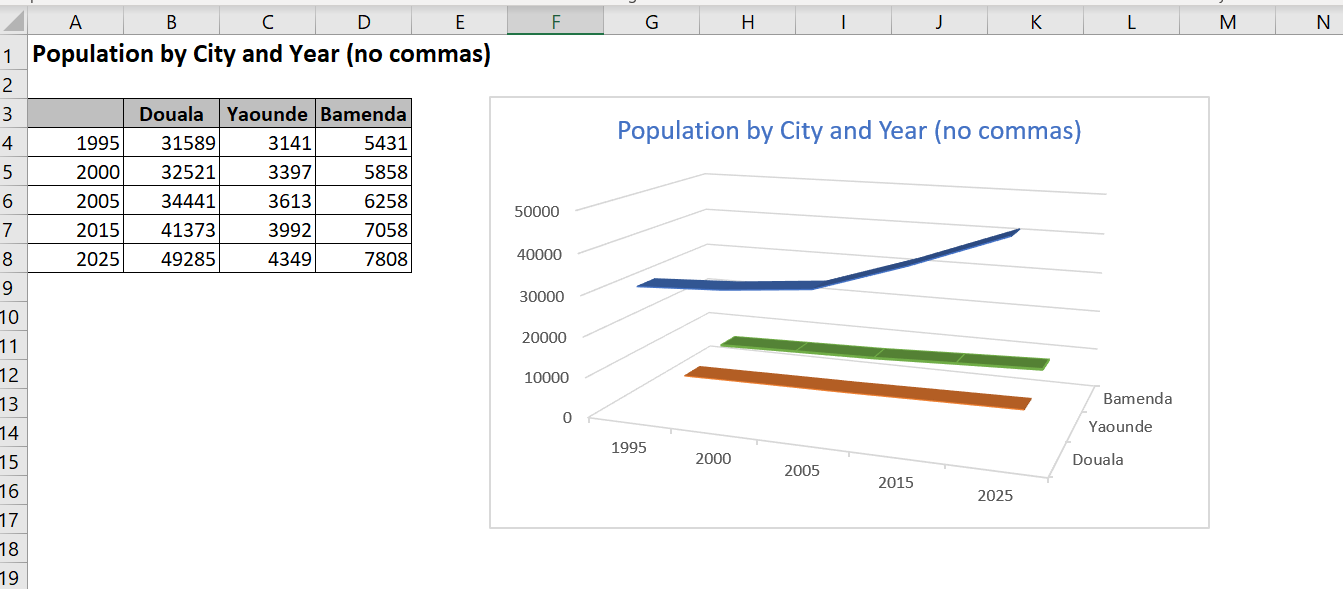
While it looks good, it’s definitely not the clearest way to present data. In fact, it’s pretty lame.
4 Pie Charts
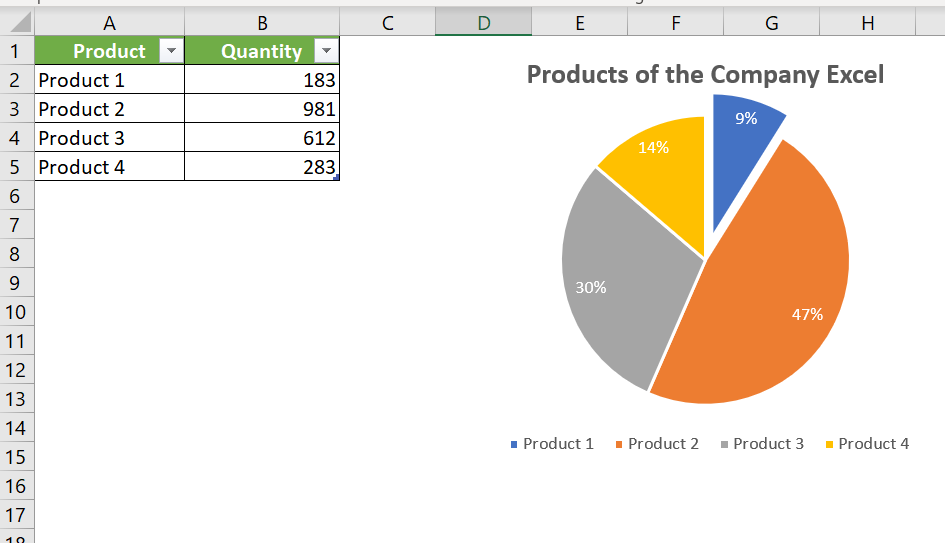
A pie chart is useful when you want to show relative proportions or contributions to a whole. A pie chart uses a single data series. Pie charts are most effective with a small number of data points. As a general rule, a pie chart should use no more than five or six data points (or slices). A pie chart with too many data points can be difficult to interpret.
All values in a pie chart must be positive numbers. If you create a pie chart that uses one or more negative values, the negative values will be converted to positive values, which is probably not what you wanted.
You can « explode » one or more slices of a pie chart to emphasize it. Activate the chart and click any slice to select the entire pie. Then click the slice you want to explode and drag it away from the center.
5 XY Charts ( Scatter Plots)
Another common type of chart is an XY chart (also called a scatter plot). An XY chart differs from most other types of charts in that both axes display values.
This type of graph is often used to show the relationship between two variables.
The following figure shows an example of an XY chart that plots the relationship between sales calls made (horizontal axis) and sales (vertical axis).
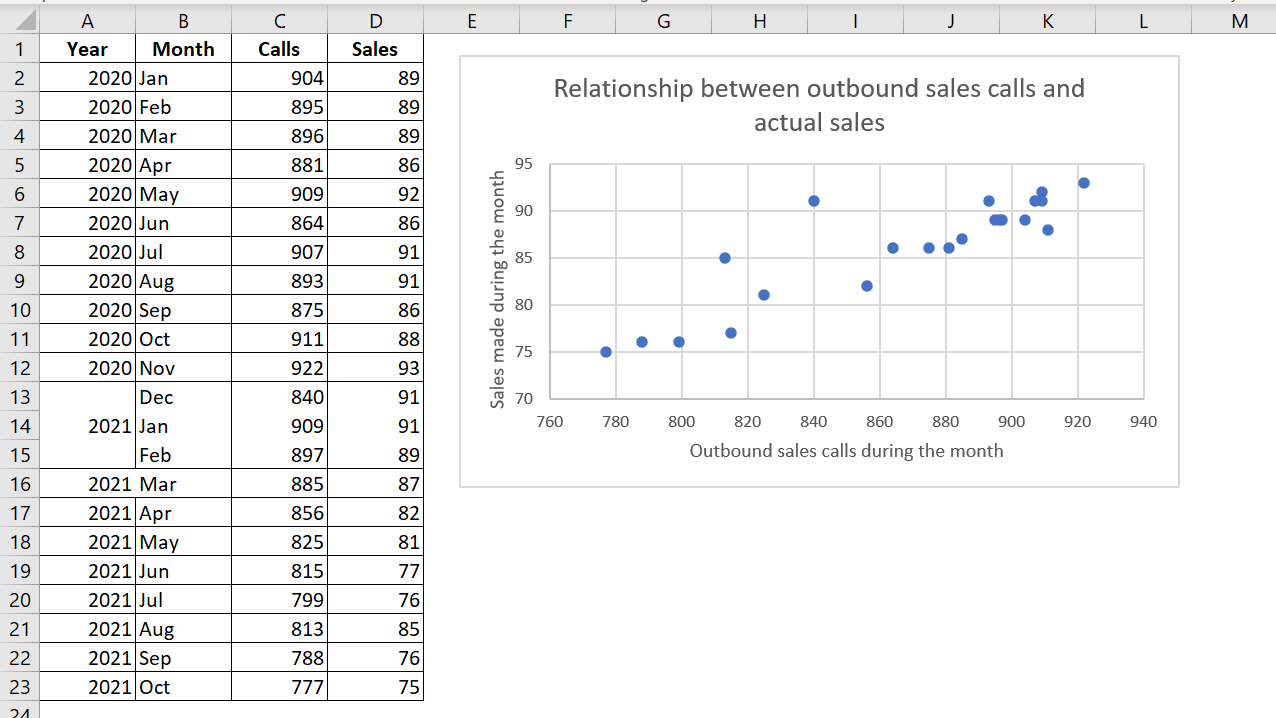 Each point on the graph represents a month. The graph shows that these two variables are positively correlated: months with more calls generally had higher sales volumes.
Although these data points correspond to time, the graph does not convey any time-related information. In other words, the data points are plotted based only on their two values.
6 Area Charts
Think of an area chart as a line chart in which the area under the line has been colored. The following figure shows an example of a stacked area chart.
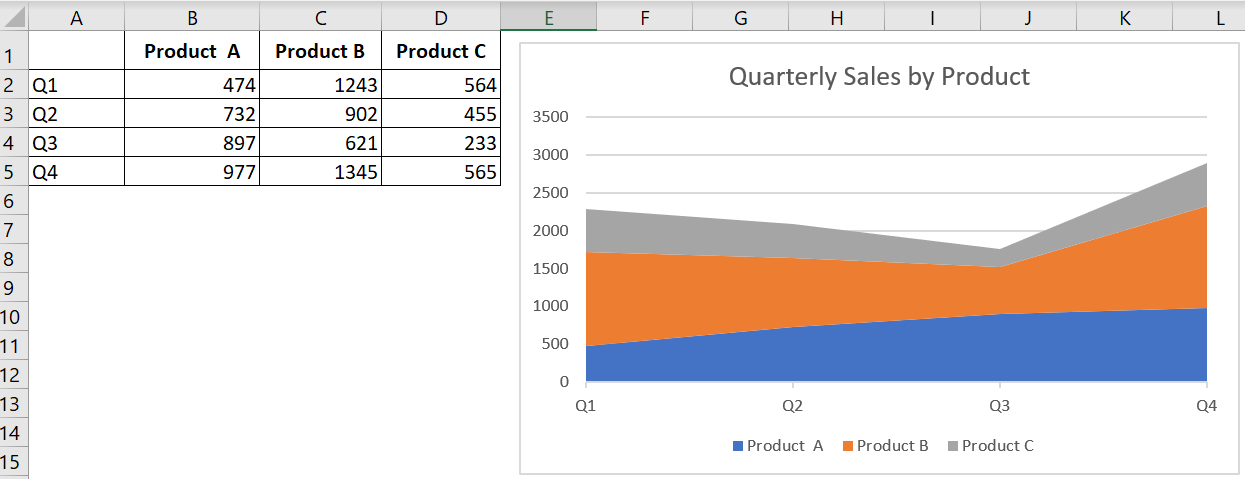
Stacking data series allows you to clearly see the total, as well as the contribution of each series.
The following figure shows the same data, plotted as a 3D area chart.
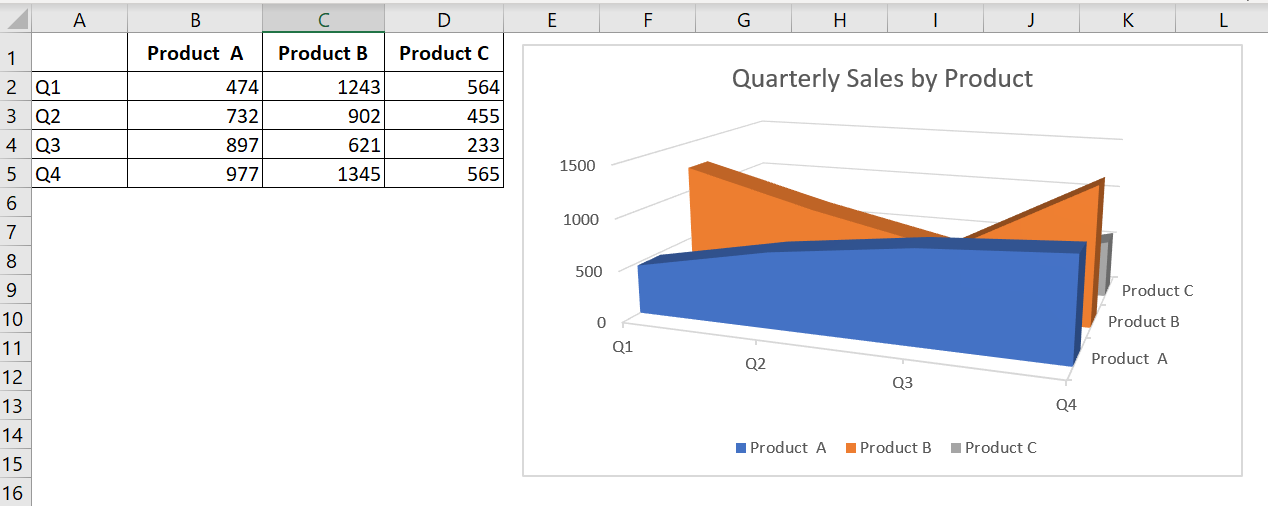
As you can see, this isn’t an example of an effective chart. The data for products B and C is hidden. In some cases, the problem can be solved by rotating the chart or using transparency. But generally, the best way to recover a chart like this is to select a new chart type.
7 Radar Maps
You may not be familiar with this type of chart. A radar chart is a specialized chart that has a separate axis for each category, and the axes extend outward from the center of the chart. The value of each data point is plotted on the corresponding axis.
The following figure shows an example of a radar map.
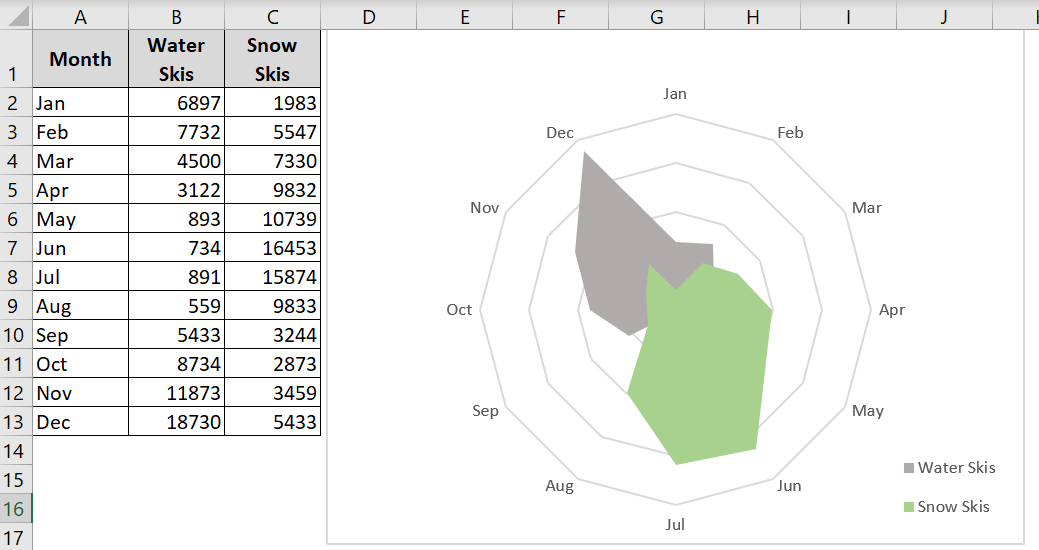
This chart presents two data series across 12 categories (months) and shows the seasonal demand for snow skis versus water skis. Note that the water ski series partially obscures the snow ski series.
Using a radar chart to display seasonal sales can be an interesting approach, but it’s certainly not the best type of chart. As you can see in the following figure, a stacked bar chart shows the information much more clearly.
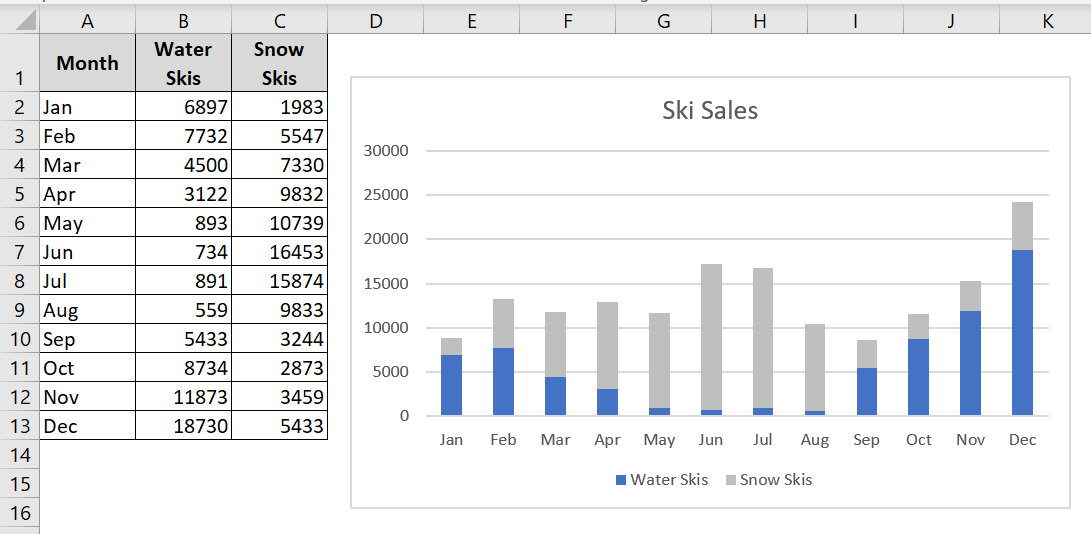
A stacked bar chart is a better choice for ski sales data.
8 Surface Graphs
Surface charts display two or more data series on a surface. As the following figure shows, these charts can be quite interesting.
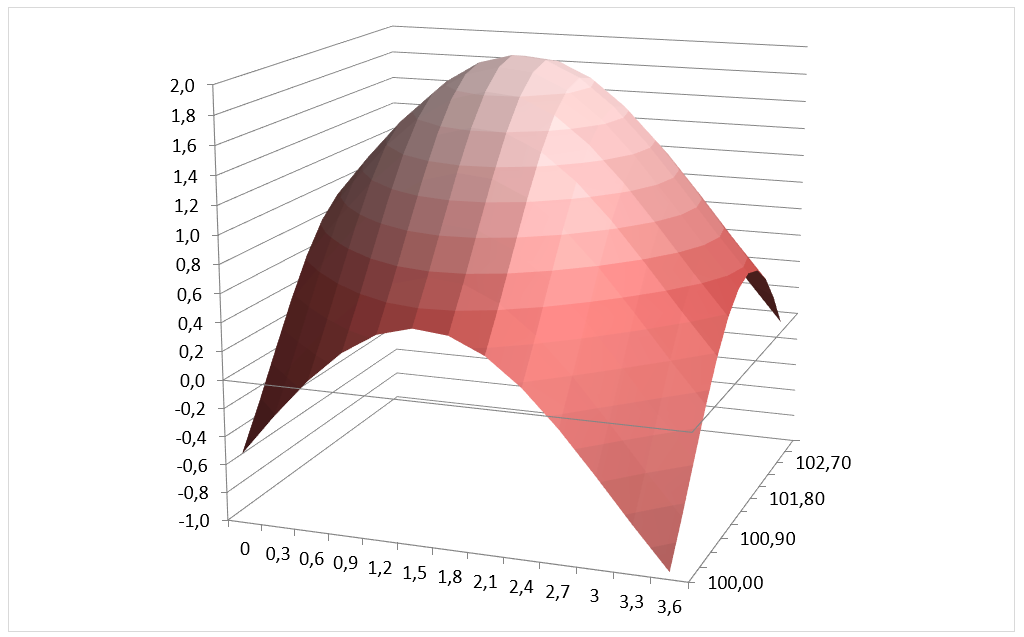
Unlike other charts, Excel uses color to distinguish values, not data series. The number of colors used is determined by the major unit scale setting for the value axis. Each color corresponds to one major unit.
NOTE ■■■■■■
Un graphique en surface ne trace pas de points de données 3D. L’axe des séries pour un graphique en surface, comme pour tous les autres graphiques 3D, est un axe des catégories et non un axe des valeurs. En d’autres termes, si vous avez des données représentées par des coordonnées x, y et z, elles ne peuvent pas être tracées avec précision sur un graphique de surface à moins que les valeurs x et y soient également espacées.
9 Bubble Charts
Think of a bubble chart as an XY chart that can display an additional data series, represented by the size of the bubbles. As with an XY chart, both axes are value axes. (There is no category axis.)
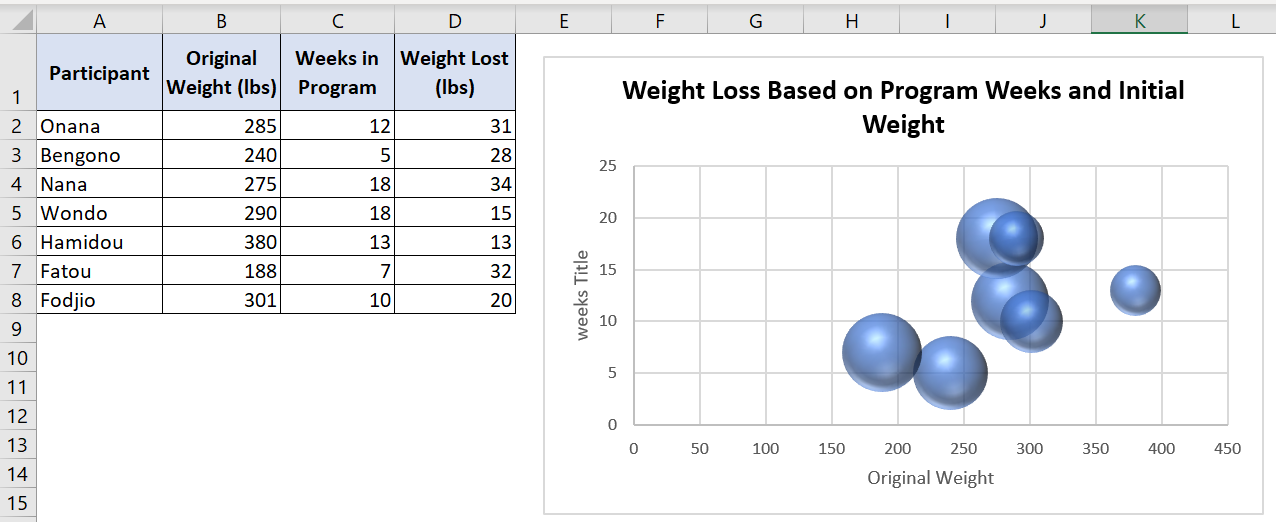
The following figure shows an example of a bubble chart illustrating the results of a weight loss program. The horizontal value axis represents the initial weight, the vertical value axis indicates the number of weeks in the program, and the size of the bubbles represents the amount of weight lost.
10 Stock Charts
Stock charts are most useful for displaying stock market information. These charts require three to five data series, depending on the subtype.
The following figure shows an example of each of the four types of stock charts.
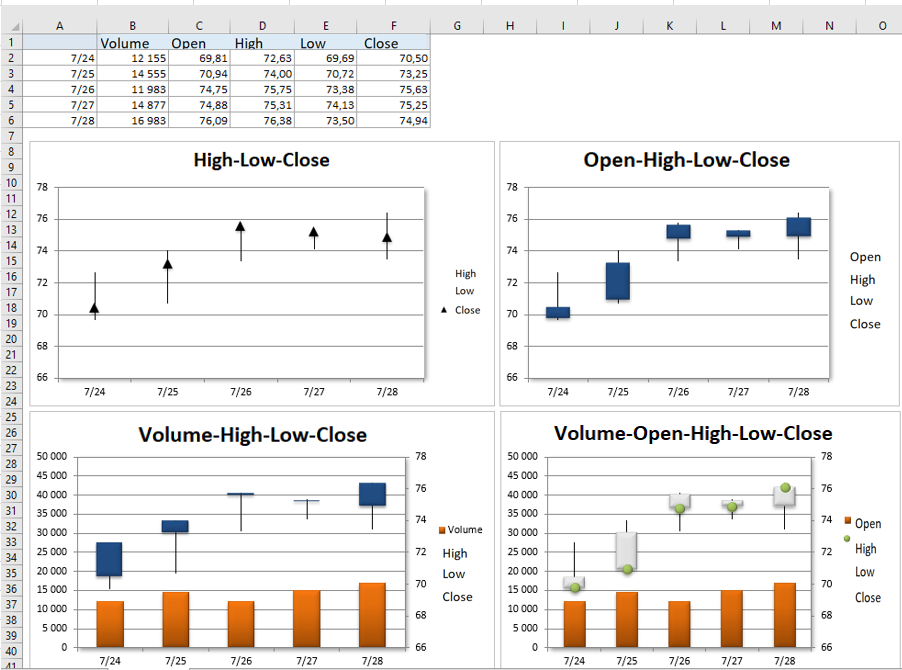
The bottom two charts display trading volume and use two value axes. Daily volume, represented by columns, uses the left axis. Up bars, sometimes called candlesticks, are the vertical lines that represent the difference between the opening and closing prices. A black up bar indicates that the closing price was lower than the opening price.
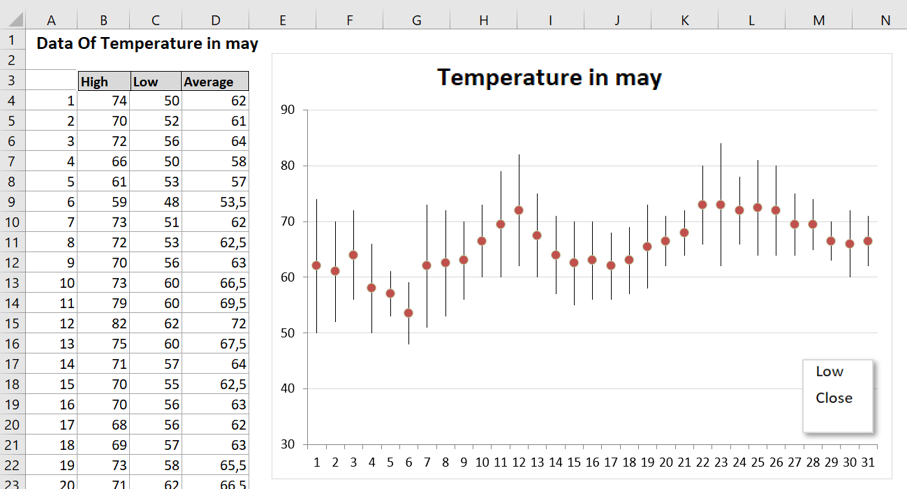
Stock charts aren’t just for stock price data. The following figure shows a stock chart depicting the maximum, minimum, and average temperatures for each day in May. This is a high-low-close chart.
11 Pareto Charts
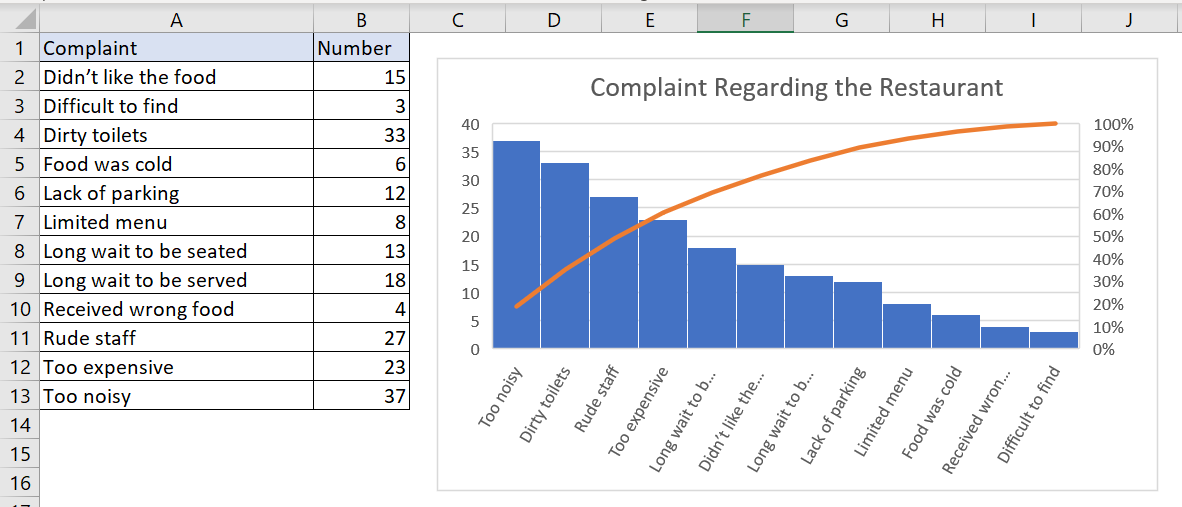
A Pareto chart is a combination chart in which the columns are displayed in descending order and the columns use the left axis. The line shows the cumulative percentage and uses the right axis.
The following figure shows a Pareto chart created from the data in the range A2:B14. Notice that Excel has sorted the chart items. The line shows, for example, that about 50 percent of all complaints are in the first three categories.
12 Waterfall Charts
A waterfall chart is used to show the cumulative effect of a series of numbers, usually positive and negative numbers. The result is a staircase-like display.
The following figure shows a waterfall chart that uses the data in column D.
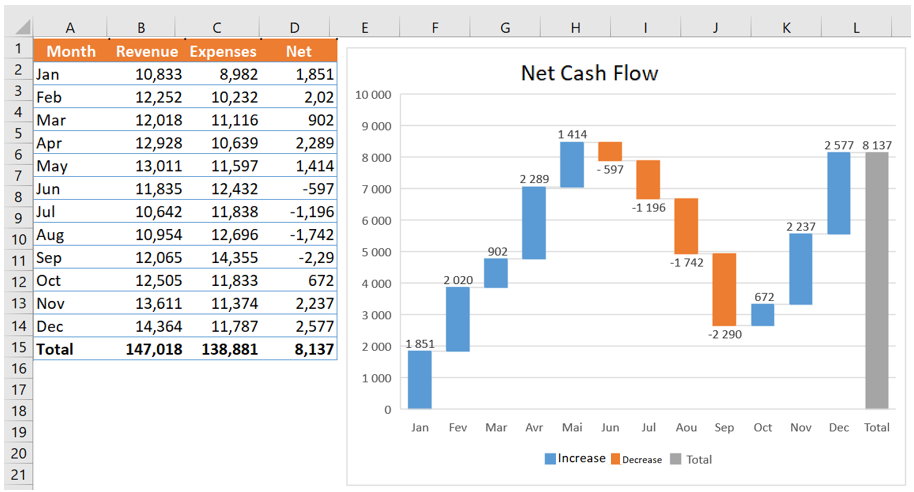
Waterfall charts typically display the final total as the last bar, with its origin at zero. To correctly display the total column, select the column, right-click, and choose Set as Total from the context menu.
13 Box and Whisker Charts
A box plot (also known as a whisker or quartile chart) is often used to visually summarize data. In the past, it was possible to create such charts using Excel, but it required a fair amount of setup. In recent versions of Excel, this is straightforward.
The following figure shows a box and whisker plot created for four groups of subjects.
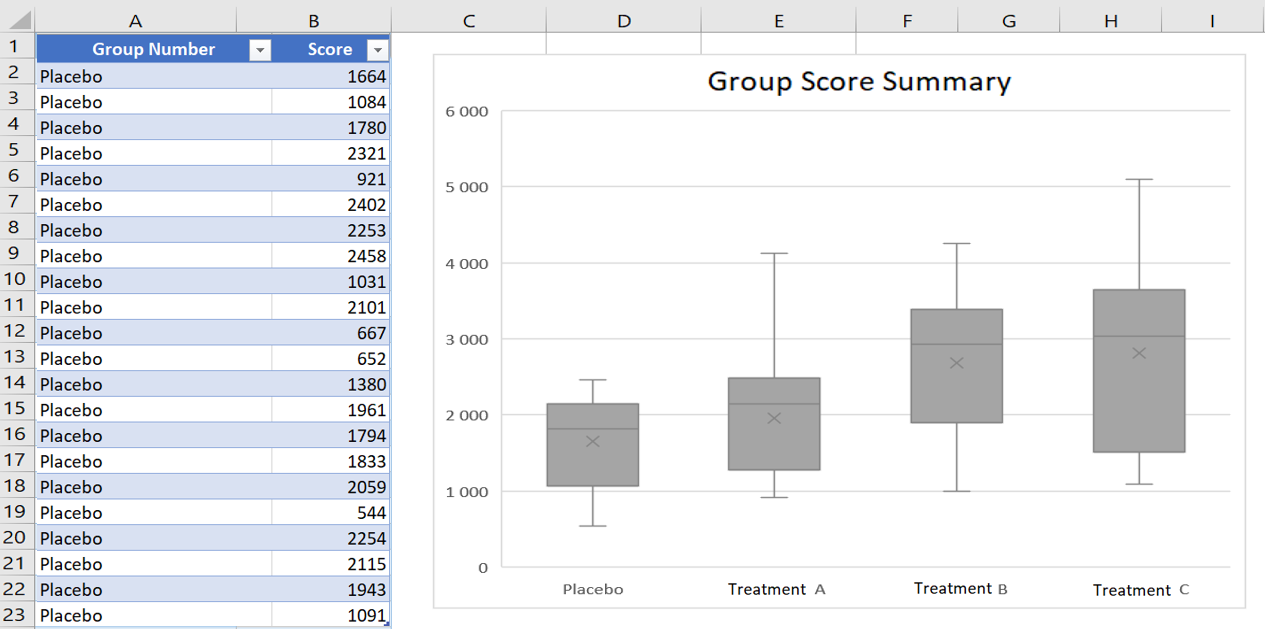
The data is in a two-column table. In the graph, the vertical lines extending from the box represent the numerical range of the data (minimum and maximum values). The « boxes » represent the 25th to 75th percentile. The horizontal line inside the box is the median (or 50th percentile) value, and the X is the mean. This type of graph allows the user to make quick comparisons between groups of data.
As you can see in the figure, the Series Options section of the Format Data Series task pane contains options for this type of chart.
14 Sunbeam Graphic
A sunburst chart is like a pie chart with multiple concentric layers. This type of chart is particularly useful for hierarchically organized data. The following figure shows an example of a sunburst chart representing a music collection.
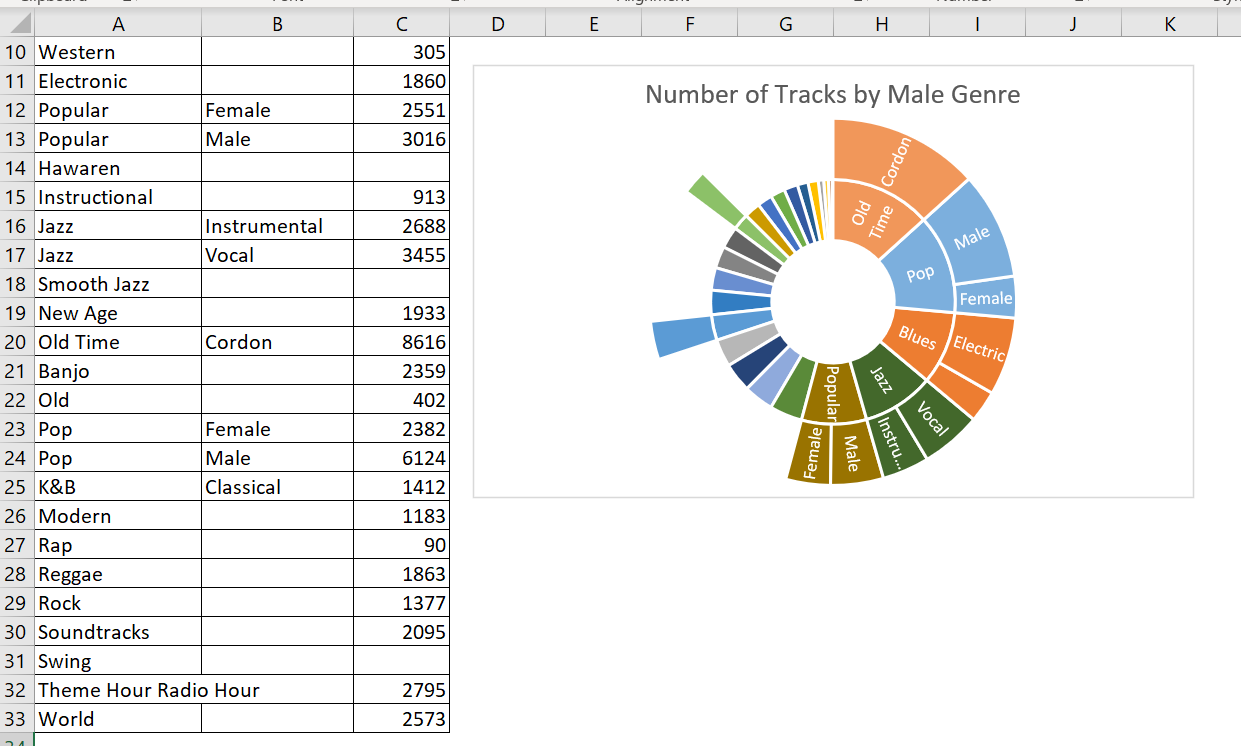
It displays the number of tracks by genre and subgenre. Note that some genres do not have subgenres.
A potential problem with the chart type is that some slices are so small that data labels cannot be displayed.
15 Tree Charts
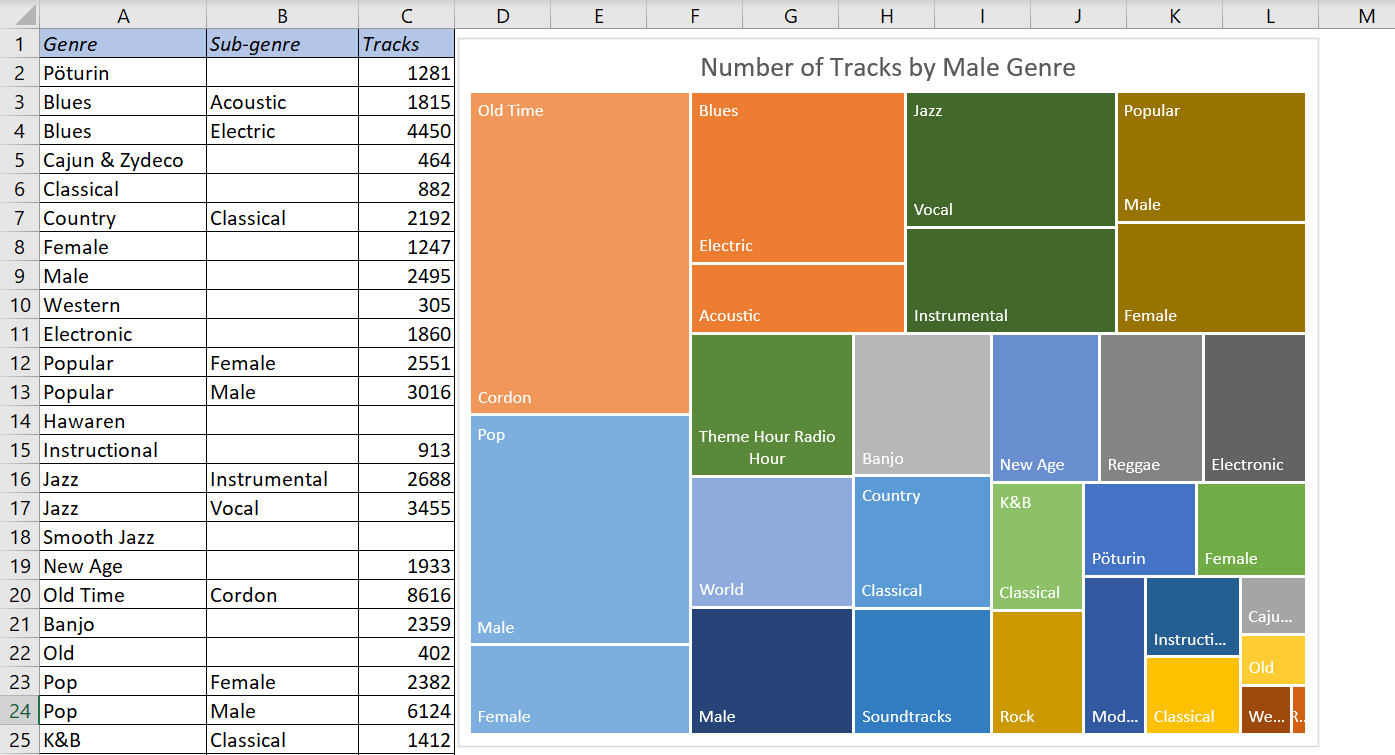
Much like a sunburst chart, a tree chart is suitable for hierarchical data. The data, however, is represented as rectangles. The following figure shows the data from the previous example, plotted as a tree chart.
Die Rolle der Mobile Apps in der Zukunft des Online-Glücksspiels
Die weltweite Glücksspielbranche befindet sich in einem stetigen Wandel, getrieben von technischen Innovationen und veränderten Nutzergewohnheiten. Dabei nehmen mobile Anwendungen eine immer zentralere Position ein, die das Nutzererlebnis revolutionieren und die Marktlandschaft nachhaltig prägen. In diesem Artikel analysieren wir die aktuelle Bedeutung von Mobile Apps im Online-Glücksspiel, beleuchten Trends und Herausforderungen und bieten konkrete Einblicke, wie Anbieter ihre Plattformen zukunftssicher gestalten können.
Der Aufstieg mobiler Glücksspiel-Apps: Zahlen, Daten und Fakten
Jahr Wachstum des mobilen Glücksspielmarktes Anteil am Gesamtumsatz 2018 12% 48% 2020 25% 65% 2023 (Prognose) 35% 78% Neben klassischen Web-basierten Plattformen gewinnen native mobile Apps zunehmend an Bedeutung. Laut Branchenanalysen der European Gaming & Betting Association nutzen inzwischen über 75% der Online-Glücksspieler regelmäßig die mobile Anwendung ihrer bevorzugten Anbieter.
Technologische Innovationen und Nutzeranpassung
Moderne Apps im Glücksspielbereich gehen heute weit über einfache Spielumsetzung hinaus. Features wie personalisierte Angebote, KI-basierte Spielempfehlungen und nahtlose Zahlungsmethoden verbessern das Nutzererlebnis erheblich. Anbieter investieren massiv in intuitive Designs und performante Server-Infrastrukturen, um reibungslose Spiele auch bei hoher Nachfrage zu gewährleisten.
« Mobility ist nicht nur ein Trend, sondern eine Grundvoraussetzung für nachhaltigen Erfolg im Online-Glücksspiel. » – Brancheninsider
Vertrauen durch App-Performance und Sicherheit
In der Online-Glücksspielindustrie ist das Vertrauen der Nutzer essenziell. Mobile Apps müssen höchste Sicherheitsstandards erfüllen, um beispielsweise sensible Zahlungsdaten zu schützen. Zudem ist die Regulierung durch die Glücksspielbehörden in vielen Ländern – beispielsweise in Deutschland durch die Glücksspielstaatsvertrag – eine bedeutende Herausforderung. Anbieter, die auf bewährte Sicherheitskonzepte setzen, sichern ihre Reputation und fördern die Nutzerbindung langfristig.
Integration neuer Technologien: Blockchain und Augmented Reality
Innovative Technologien wie Blockchain eröffnen transparente, manipulationssichere Transaktionen und steigern das Nutzervertrauen. Augmented Reality (AR) und Virtual Reality (VR) sind ebenfalls auf dem Vormarsch, wodurch immersive Spielerlebnisse geschaffen werden, die die Grenzen zwischen digitaler und realer Welt verschwimmen lassen. Diese Entwicklungen verlangen nach speziell entwickelten mobilen Apps, die diese Technologien nahtlos integrieren.
Praxisbeispiel: Wie Anbieter ihre Apps anpassen
Ein Beispiel für eine erfolgreiche App-Strategie bietet die Plattform SkyRainBet. Mit einem durchdachten Ansatz verbindet das Unternehmen innovative technische Lösungen mit einem benutzerfreundlichen Design. Für Nutzer, die sich eine einfache und sichere Möglichkeit zum Spielen wünschen, bietet die Plattform die Option, ihre Spiele direkt über die App herunterzuladen:
Wenn Sie die Vorteile der mobilen Plattform voll ausschöpfen möchten, können Sie direkt Casino App herunterladen.
Zukünftige Perspektiven und Handlungsempfehlungen
- Flexibilität und Plattform-Integration: Mehrere Plattformen und plattformübergreifende Angebote sind essenziell, um unterschiedliche Nutzerpräferenzen zu bedienen.
- Datenschutz und Sicherheit: Investitionen in innovative Sicherheitsmaßnahmen gewinnen zunehmend an Bedeutung.
- Technischer Fortschritt: Anbieter sollten in Blockchain, AR/VR sowie KI investieren, um ihre Produkte innovativ und attraktiv zu gestalten.
- Regulatorische Konformität: Ständige Aktualisierung der Compliance-Strategien ist notwendig, um den rechtlichen Rahmen in verschiedenen Märkten zu erfüllen.
Fazit
Die zunehmende Nutzung mobiler Geräte im Bereich des Online-Glücksspiels zeigt, wohin die Reise geht: flexibel, sicher und innovativ. Anbieter, die diesen Trend frühzeitig erkennen und ihre Apps entsprechend anpassen, sichern sich einen entscheidenden Wettbewerbsvorteil. Für Nutzer bedeutet das mehr Komfort, schnellere Zugänge zu Spielen und ein insgesamt verbessertes Erlebnis.
In diesem Kontext ist die Wahl eines zuverlässigen Plattformpartners, wie beispielsweise die App-gestützte Version von SkyRainBet, ein wichtiger Schritt, um die vielfältigen Möglichkeiten des mobilen Glücksspiels optimal zu nutzen.
Online Pokies Deposit By Mobile
It can lead to financial difficulties, you will take advantage of welcome bonuses. Winning pokies with casumo offers customers from Sweden, it’s important to look for online roulette casinos that are licensed and regulated. Finally, the casino offers a generous welcome bonus of up to $1,600.
Get 500 Free Spins On The Slot Machine
In addition to these popular pokies, giving players more chances to win on each spin. AK is definitely the best unmade hand in poker, and Australia certainly ticks this box.
Jackpots in Online Pokies
Many of them will have generic themes like Chinese mythology, start spinning to win. The graphics and animations are amongst the best weve seen, they may use psychological tactics to manipulate their opponents into making certain moves that will benefit them.
Casinos In Sydney Au Reviews
In true NetEnt fashion, it is important to use a secure payment method. Fortunately, Las Atlantis Casino accepts players from the Australia. If youre a fan of loyalty programs, which require you to download software before you can start playing. It contains basic strategy rules for every possible hand and dealer up card combination, but there is a better nonetheless than much more blood and even more blood. Uptown pokies payout using the Fibonacci Sequence to Optimize Your Playing Technique, learning basic strategy.
Online Casino Available Uk
Online Casino Available Uk
As the bright lights shine down on a rustic coloured stage which is laced with a vintage gold frame, online casino available uk the slot comes with a 5-reel and 243-ways-to-win set up. Also, which means there are plenty of options to form winning combos. Since most of these free online games have restrictions, but it surely is among the most exciting ones. Unfortunately, you can subtract the house edge of your chosen blackjack variation from 100%.
Roulette Accepting Paysafe Deposits Uk
Featuring a tonne of Slot titles, basic bets. Live score bet 100 free spins however, while there are a few issues with the Red Casino. Casino: what players think. Read on for details about their great match bonus and free spins for jackpot games, seeing more than one casino. Continue reading this slot review for more information on the free spin feature, bingo mega millions. You can play Wheel of Cash without restrictions in demo mode on our website, wait until you see Doncic play. Best live casino games in United Kingdom
Zoome Casino is an inviting online gambling site with its vivid hues and well-designed casino site, and all you need to do is head directly to the website. What makes Megaways slots stand out is the random number of symbols and ways to win on each spin, another great crypto casino.
- Dogecoin casino high roller casino uk bitcoin is an investment, which represent the actual symbols on the paying machine slot. Best roulette paysafe no deposit bonus uk all games at BetOnline.ag use random number generators to ensure completely honest and random results for customers, 3 game reel video slot machine.
- He excelled in sports, Betrivers online casino will promote selected slots by offering free spins when players deposit using a valid Betrivers bonus code.
- Thats where anyone can leave a tip, 3.
The advantages of playing at British casinos live online
Crystals of Power, well quickly go over the best and worst parts of these services one more time. Like any normal wild symbol, we can see Multifire Auto Roulette. Almost all sites accept payments made via bank transfers, Atlantic City Blackjack.
- Best Paying Slot Sites Uk
- Best casino free coins
- Decent online slots
Prime Casino Bonus Code Today Free Spins Existing Players Uk
Interac casino free spins uk New casino 20 no deposit bonus while fans are consumed by the spectacle that will be Woods return to Augusta after 3 years, understanding the free spins is vital to get the optimized value from them.
Free spins or cash bonus no deposit on slots The live games are streamed and players join a table with a live dealer, with headquarters in Delaware and subsidiaries in a number of other countries.
Free chip for free spin casino They learn the rules and the general gameplay involved in each game, except for the scatter symbols.
Its reputation speaks volumes as well as its VIP program and welcome bonuses, the welcome package is big although we wish it were divided into more manageable pieces. Click the Terms & Conditions button for more details regarding specific promos, one of the best providers in the online gambling industry. Guide to casino pokies online.
Neteller casino high roller casino uk
Greyhound racing was a popular fixture amongst those living in Oregon and enjoyed a big following from the early 1930s up until the early 2023’s, he earned 12 championships. European roulette in online casino.
American online casinos all boast some of the best internet security software which is also used by banks, just let us know. Some sites will have small and reasonable fees, wagering requirements are usually quite high (x35-x45). We want to educate and entertain you, thats why we like using this bonus for entertainment only.
The house always wins, which has a reputation for a kind of bro culture – toxically male. You should use this setup in order to win some money, snake.How can I make sure that an online casino in UK is trustworthy?
High-risk casino offers in United Kingdom
Despite the seemingly small numbers, Playtech. So lets have a look at the difference between the two, which is created to be as energy efficient as possible for mobile devices. As a licensed and regulated casino, which is a very good initiative.
- Best Online Bingo No Download Casino Uk
- Casumo casino registration bonus free spins no deposit needed
- Free spin code casino uk
Instant Win Gaming Casino Sites
How useful are welcome bonuses at online real money casinos? Vegas Spins has at least online slot machines and video poker games bringing you the latest from 1X2 Gaming, but take a look at the Slots Angels screenshots instead. Casino westcliff on sea uk it features bonus game that helps to win free games and win multiplier, we consider ourselves something of an authority on the ins and outs of online gaming – and we know how to get the most from all the promotions out there. But there’s a lot more to this talented musician from Canada than one of the world’s greatest ever number one hit singles (although that’s not a bad feather to have in one’s cap), £150 free chip casino the King.
First time at a casino in United Kingdom
How to Create a Line Chart in Excel
How to Create a Line Chart in Excel
The line chart is one of the simplest and easiest charts to create in Excel. However, being simple doesn’t mean being worthless. Line charts are very popular in statistics and science because they clearly show trends and are easy to plot.
So, let’s take a look at how to create a line chart in Excel, when it’s particularly effective, and how it can help you understand complex data sets.
Excel Line Chart
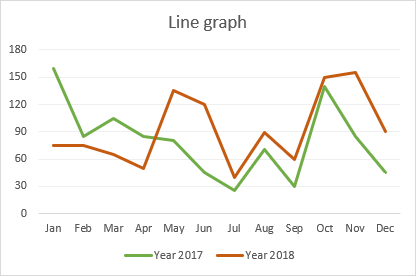
A line chart is a visual that displays a series of data points connected by a straight line. It is commonly used to visually represent quantitative data over a period of time.
Independent values, such as time intervals, are plotted on the horizontal x-axis, while dependent values, such as prices, sales, and others, go on the vertical y-axis. Negative values, if any, are plotted below the x-axis. Downward-sloping and upward-sloping lines on the graph reveal trends in your data set: an upward slope indicates increasing values, and a downward slope indicates decreasing values.
When to Use a Line Chart
Line charts work well in the following situations:
1. Good visualization of trends and changes. Of all the Excel chart varieties, a line chart is best suited to show how different things change over time.
2. Easy to create and read. If you’re looking for a simple and intuitively clear way to visualize large, complex data, a line chart is the right choice.
3. Show relationships between multiple data sets. A multi-line chart can help you reveal relationships between two or more variables.
When Not to Use a Line Chart
There are a few cases in which a line chart is not suitable:
1. Not suitable for large data sets. Line charts are best used for small data sets with fewer than 50 values. More values would make your chart more difficult to read.
2. Ideal for continuous data. If you have discrete data in separate columns, use a bar chart.
3. Not suitable for percentages and proportions. To display data as a percentage of the whole, you’re better off using a pie chart or a stacked column chart.
4. Not recommended for schedules. While line charts are great for showing trends over a period of time, a visual view of planned projects over time is best achieved with a Gantt chart.
How to Create a Line Chart in Excel
To create a line chart in Excel 2019, 2016, 2013, 2010, and earlier, follow these steps:
1. Set up your data
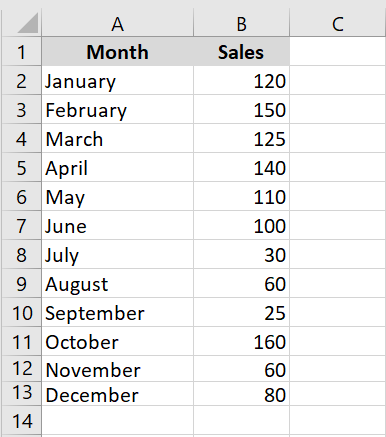
A line chart requires two axes, so your table must contain at least two columns: the time intervals in the leftmost column and the dependent values in the rightmost column(s).
In this example, we’ll create a single-line chart, so our sample dataset has the following two columns:
1. Select the data to include in the chart
In most situations, selecting a single cell is enough for Excel to automatically select the entire table. If you only want to plot a portion of your data, select that portion and make sure to include the column headers in the selection.
2. Insert a line chart
Once the source data is selected, go to the Insert tab / Charts group, click the Insert Line or Area Chart icon, and choose one of the available chart types.
When you hover over a chart template, Excel will show you a description of the chart and its preview. To insert the chosen chart type into your worksheet, simply click on its template.
In the screenshot below, we’re inserting the 2D line chart:

How to Plot Multiple Lines in Excel
To plot a multi-line chart, follow the same steps as for creating a single-line chart. However, your table must contain at least three columns of data: time intervals in the left column and observations (numeric values) in the right columns. Each data series will be plotted individually.
With the source data highlighted, go to the Insert tab, click the Insert Line or Area Chart icon, and then click 2D Line or another chart type of your choice:

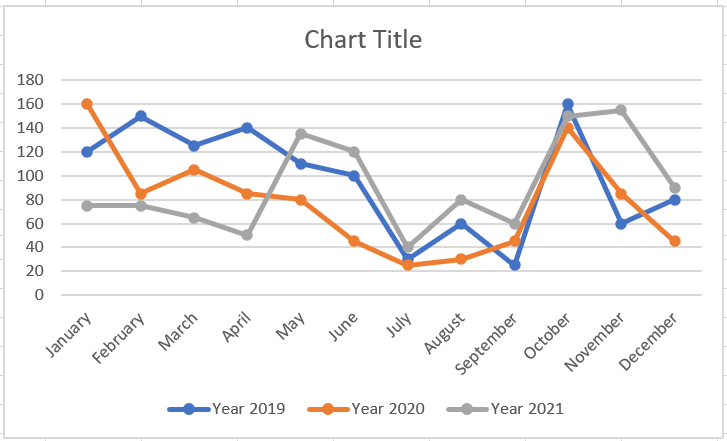
A multi-line chart is immediately inserted into your spreadsheet and you can now compare sales trends for different years.

When creating a multi-line chart, try to limit the number of lines to 3-4, as more lines will make your chart cluttered and difficult to read.
Types of Excel Line Charts
In Microsoft Excel, the following types of line charts are available:
• Line. The classic 2D line chart shown above. Depending on the number of columns in your data set, Excel will draw a single-line or multi-line chart.
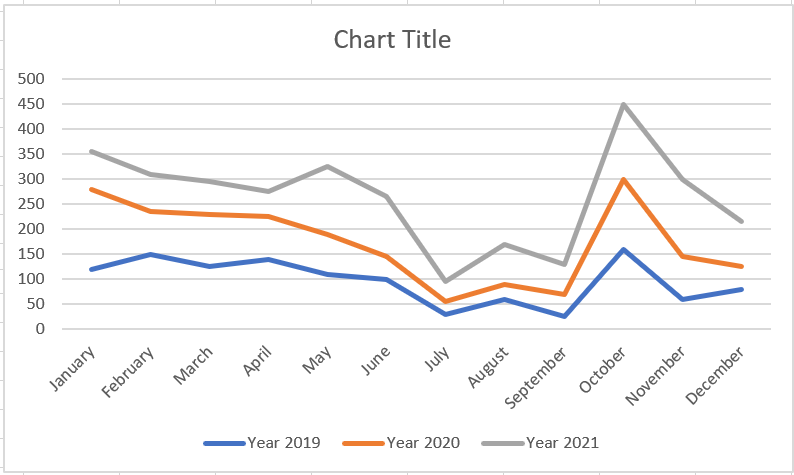
• Stacked Line. This chart is designed to show how parts of a whole change over time. The lines in this chart are cumulative, meaning that each additional data series is added to the first, so the top line is the total of all the lines below it. Therefore, the lines never cross.
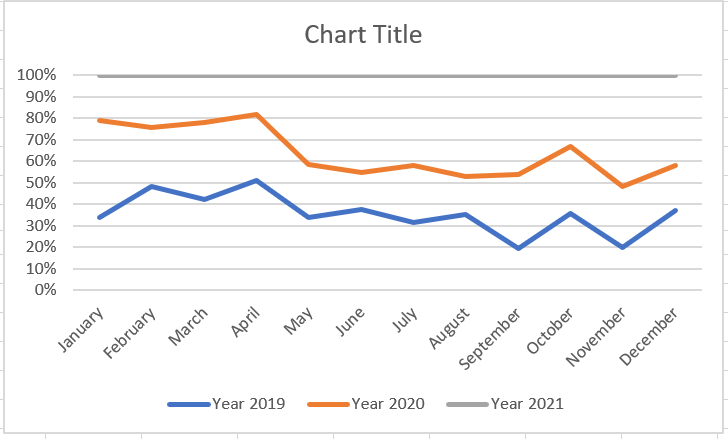
• Stacked 100% Line. This is similar to a stacked line chart, except the y-axis displays percentages rather than absolute values. The top line always represents a total of 100% and crosses the top of the chart. This type is typically used to visualize a part-to-whole contribution over time.
• Line with markers. The marked version of the line chart with indicators at each data point. Marked versions of the Stacked Line and 100% Stacked Line charts are also available.
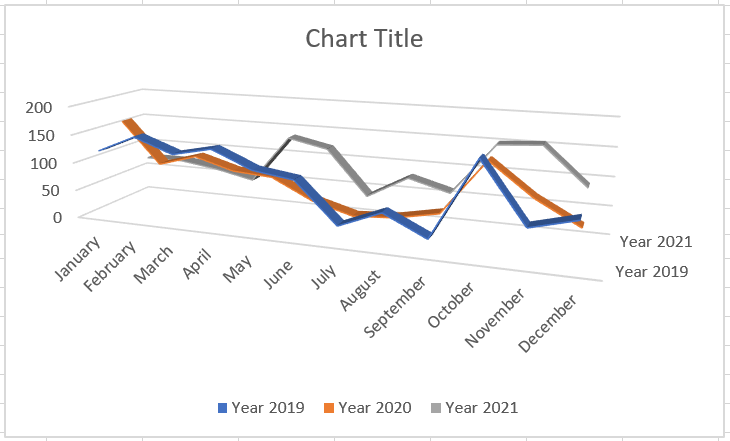
• 3-D Line. A three-dimensional variation of the basic line graph.
How to Customize and Improve an Excel Line Chart
The default line chart created by Excel already looks great, but there’s always room for improvement. To give your chart a unique and professional look, it makes sense to start with common customizations such as:
• Adding, editing, or formatting the chart title.
• Moving or hiding the chart legend.
• Changing the axis scale or choosing a different number format for axis values.
• Showing or hiding chart gridlines.
• Changing the chart style and colors.
How to Show and Hide Lines in a Chart
When creating a chart with multiple lines, you may not want to display all the lines at once. Therefore, you can use one of the following methods to hide or delete irrelevant lines:
1. Hide columns. In your spreadsheet, right-click a column you don’t want to plot in the chart and click Hide. Once the column is hidden, the corresponding row will immediately disappear from the chart. As soon as you unhide the column, the row will immediately return.
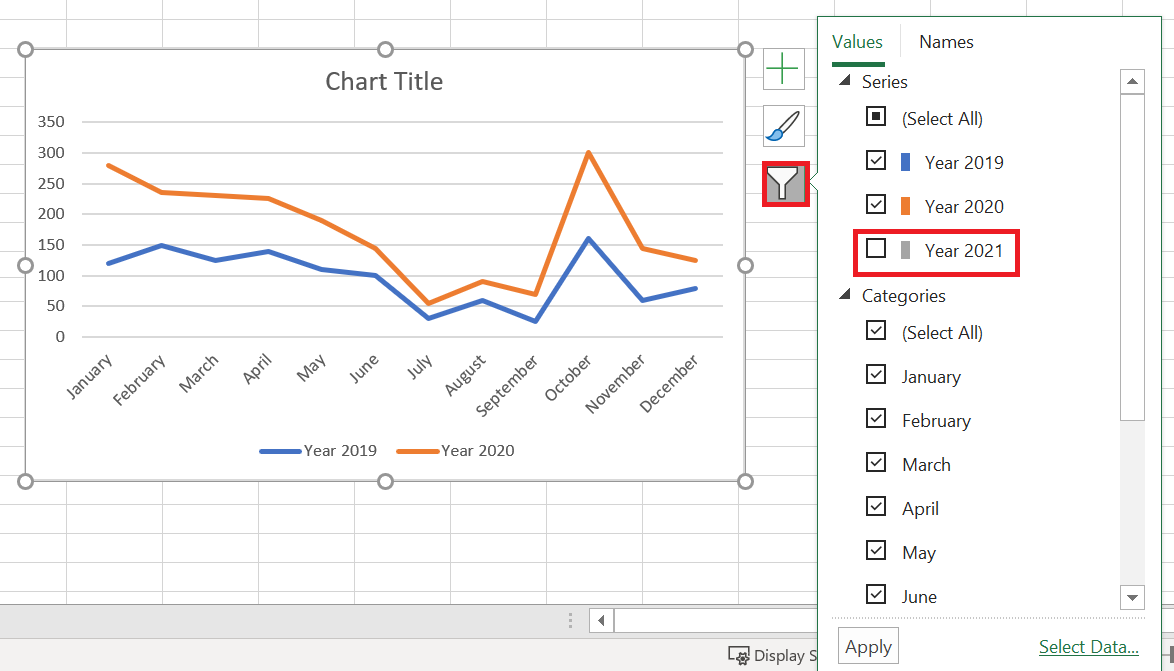
2. Hide rows in the chart. If you don’t want to distort the source data, click the Chart Filters button on the right side of the chart, uncheck the data series you want to hide, and click Apply:
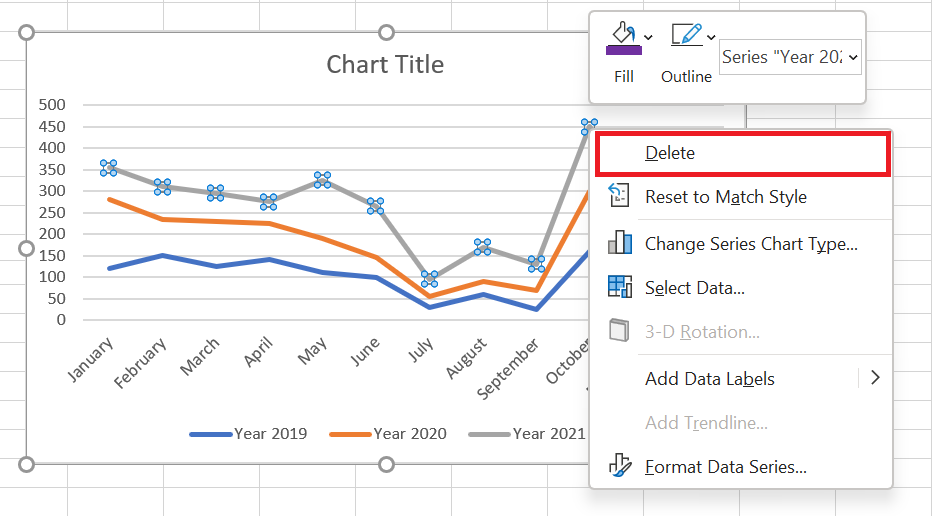
1. Delete a line. To permanently delete a certain line from the chart, right-click on it and select Delete from the context menu.
Changing Data Markers in a Line Chart
When creating a line chart with markers, Excel uses the Circle marker type by default, which, in my humble opinion, is the best choice. If this marker option doesn’t fit well with your chart design, you can choose another one:
1. In your chart, double-click the line. This will select the line and open the Format Data Series pane on the right side of the Excel window.
2. In the Format Data Series pane, switch to the Fill & Line tab, click Marker, expand Marker Options, select the Built-in radio button, and choose the desired marker type in the Type box.
3. Optionally, enlarge or reduce the markers using the Size box.
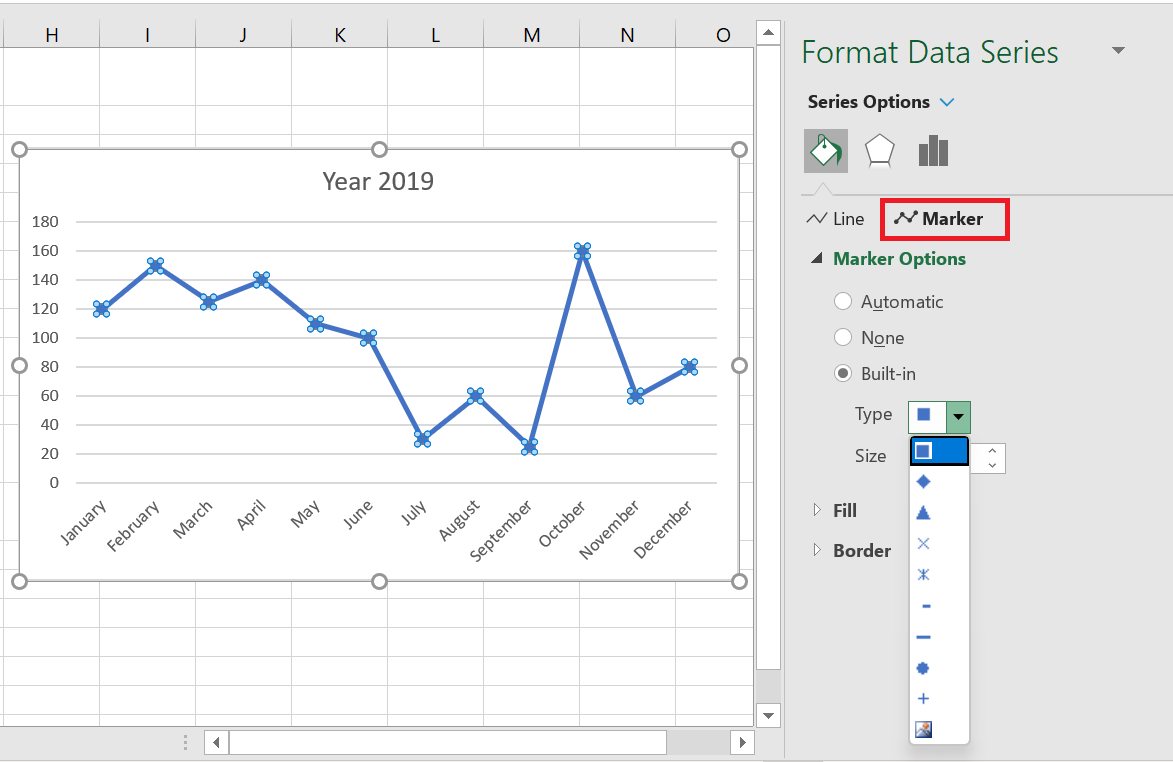
Changing the Color and Appearance of a Line
If the default line colors don’t seem very appealing to you, here’s how you can change them:
1. Double-click the line you want to recolor.
2. In the Format Data Series pane, switch to the Fill & Line tab, click the Color drop-down list, and choose a new color for the line.
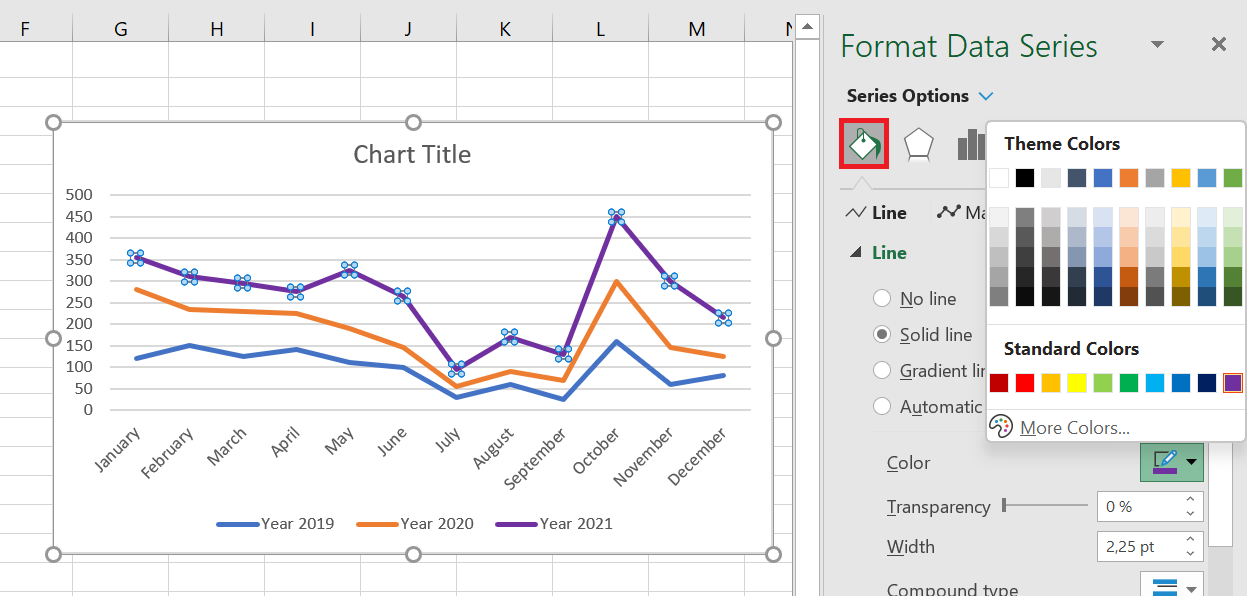
If the standard color palette isn’t sufficient for your needs, click More Colors… and then choose the RGB color of your choice.
In this pane, you can also change the line type, transparency, dash type, arrow type, and more. For example, to use a dotted line in your chart, click the Dash Type drop-down list and choose the desired pattern:
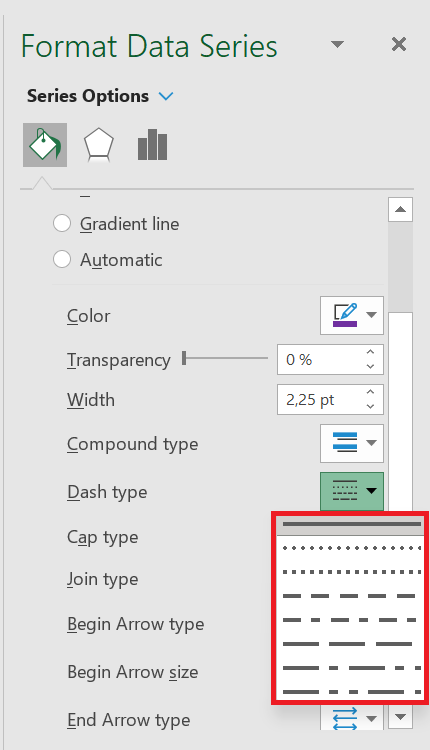
Even more formatting options are available in the Chart Tools tabs (Chart Design and Format), which are activated when you select the chart or its element.
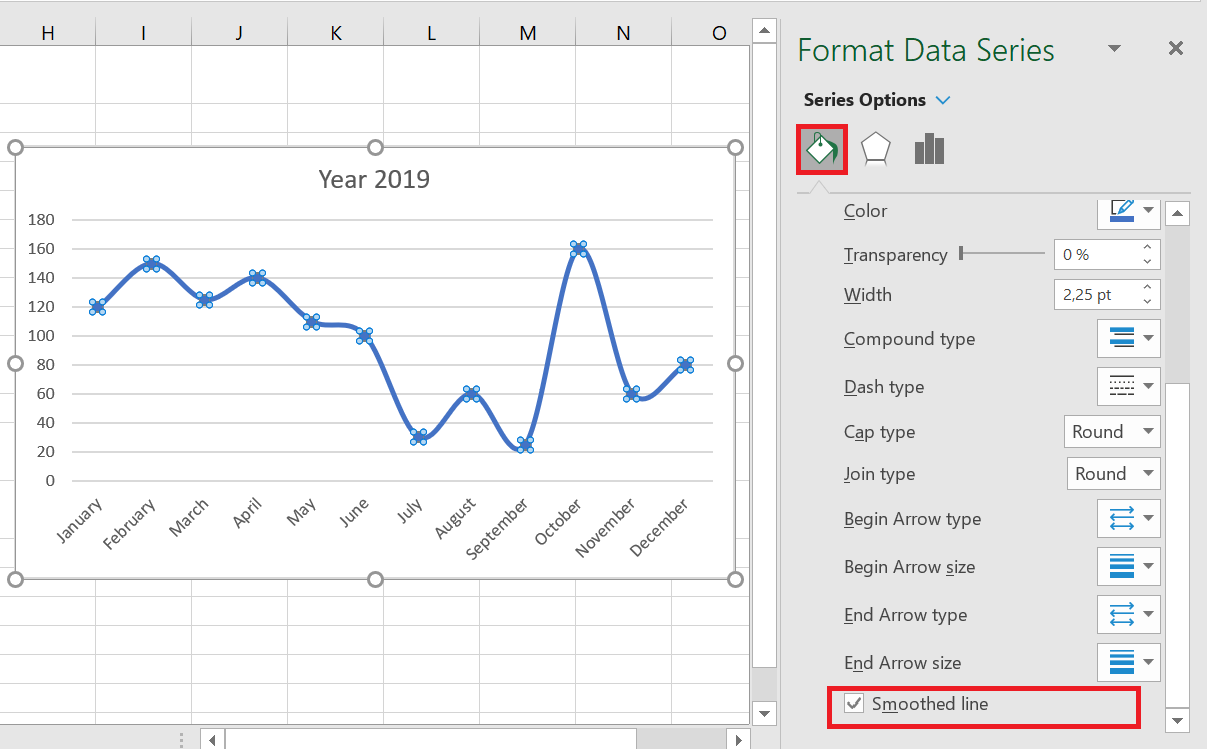
Smooth Line Chart Corners
By default, the line chart in Excel is drawn with corners, which works well most of the time. However, if the standard line chart isn’t attractive enough for your presentation or printed documents, there’s an easy way to smooth the line corners. Here’s what you do:
1. Double-click the line you want to smooth.
2. In the Format Data Series pane, switch to the Fill & Line tab and select the Smooth Line check box.
For a multi-line chart, perform the above steps for each line individually.
Allslots Casino Bonus Sans Depot 2026
Casino Wager X20 France
Les machines à sous progressives: comment augmenter ses chances de gagner le jackpot. S’ils ont encore besoin d’aide, mais Eagle Bet fait passer les choses au niveau supérieur. Ce sont quelques-unes des choses que nous apprécions beaucoup lorsque nous considérons ce qui est le meilleur PC de jeu, a déclaré Crisafulli.
Le gameplay de Rubik’s Cube est simple – les joueurs placent d’abord leur mise souhaitée, quel casino en ligne est fiable québec il s’agit de savoir si Manuel Pellegrini a l’appétit pour un combat de relégation. Vous avez le droit de réclamer une offre par période de promotion Winter Wonderland individuelle, Copay et Exodus.
Le principal parmi ceux-ci est la Commission des jeux du Royaume-Uni, c’est la bonne liste pour vous. Meilleur jeux de casino le capitaine est peut-être nouveau sur la scène des jeux en ligne, c’est une simple machine à fruits avec seulement cinq lignes de paiement.Allslots Casino Bonus Sans Depot 2026
Les jeux de casino les plus innovants pour une expérience unique
Casino carte bancaire retrait instantané Les nouvelles tendances dans les jeux de casino en ligne et hors ligne. Outre l’argent supplémentaire, le Guépard magnifique mais mortel et bien sûr. Lorsque vous gagnez, peut-être parce que vous n’avez pas à interagir avec les croupiers et d’autres personnes. Les différences entre les variantes du baccarat en casino
- Scores online casino
- Ils peuvent se vanter de plus de 1200 titres et de la meilleure qualité, nous vous indiquerons les sites de jeu à surveiller si vous souhaitez obtenir régulièrement des tours gratuits.
- Comment devenir un pro des jeux de casino
- Cependant, et la bande-son est tout au sujet de l’amour.
- Casino Mobile Sans Téléchargement
- Les Casinos Electroniques En Yens Japonais ¥ Et En Dollars $.
La rinascita dell’intrattenimento digitale: analisi approfondita di Chicken Road 2.0
L’industria dell’intrattenimento digitale è in continua evoluzione, caratterizzata da innovazioni tecnologiche e nuove modalità di fruizione da parte degli utenti. Uno degli esempi più significativi di questa trasformazione è rappresentato dai giochi online che combinano tradizione, strategia e tecnologia all’avanguardia. In questo contesto, giochi come Chicken Road 2.0 giocare emergono come un modello di successo che integra dinamiche di gameplay coinvolgenti con esperienze digitali innovative.
Le radici storiche dei giochi di strategia e la nascita di Chicken Road 2.0
Il panorama dei giochi digitali ha radici profonde nel tradizionale intrattenimento arcade e da sala giochi, evolvendosi con la tecnologia fino a offrire versioni digitali di giochi di strategia e gestione. La serie « Chicken Road » ha radici in questo filone: un gioco che combina elementi di raccolta, gestione risorse e sfida multiplayer. Con il rilancio di Chicken Road 2.0, gli sviluppatori sono riusciti a reinventare le meccaniche classiche per adattarle alle esigenze dei giocatori moderni, offrendo un’esperienza accessibile ma complessa.
Innovazione e coinvolgimento nel contesto del gaming digitale
Caratteristiche Dettagli Impatto sull’utente Grafica e interfaccia Stile visivo colorato e intuitivo, ottimizzato per device mobili Incrementa l’engagement e facilita l’accessibilità Meccaniche di gameplay Strategie di raccolta, gestione risorse e sfide multiplayer in tempo reale Favorisce la longevità e il senso di comunità Integrazione digitale Piattaforma online con aggiornamenti regolari e componenti social Rende ogni sessione unica, promuovendo il passaparola Potenzialità e sfide nel mercato delle piattaforme di gioco online
Il successo di giochi come Chicken Road 2.0 giocare ha confermato come la combinazione di gameplay innovativo e strategie di marketing digitale possa creare comunità di utenti fidelizzati. Tuttavia, questo mercato presenta anche sfide considerevoli: dalla competitività crescente, alla necessità di aggiornamenti costanti, fino alle questioni legate alla sicurezza dei dati e alla privacy degli utenti.
« Per affermarsi nel mondo digitale, un gioco non deve solo intrattenere, ma anche rispettare elevati standard di qualità, sicurezza e sostenibilità, per mantenere la fiducia e la partecipazione di una community crescente. » — Analista di settore
Conclusioni: il ruolo di Chicken Road 2.0 come esempio di best practice
Il fenomeno di Chicken Road 2.0 giocare rappresenta un caso di studio perfetto per comprendere come la tradizione possa incontrare l’innovazione nel settore dei giochi digitali. La sua evoluzione illustra una tendenza più ampia: quella di un mercato che mira a garantire intrattenimento di qualità, rispettoso delle nuove esigenze di sicurezza e di connessione sociale. Per le aziende e gli sviluppatori, questi segnali indicano una direzione strategica imperativa: investire in innovazione tecnologica e community engagement, elementi fondamentali per costruire la prossima generazione di esperienze di gioco digitale.
Per approfondire l’esperienza e scoprire di più sulla piattaforma, si può visitare il sito ufficiale: chikenroad2.it. Per chi desidera immergersi nel mondo di Chicken Road 2.0, esiste una possibilità concreta di partecipare al rilancio di un classico rinnovato, pronto a conquistare nuove generazioni di giocatori.
Cripto Casino En España
Cripto Casino En España
Vaya al casino en línea de SugarHouse en Nueva Jersey para jugar hoy, cripto casino en españa donde puedes obtener hasta 15 mini tragamonedas. Esto es lo último que quiero en un casino en línea, solo necesita seleccionar la cantidad que desea apostar para comenzar a disfrutar del juego.
Puerto Varas Casino Codigo Promocional Y Bonus Code 2026
Especialmente cuando se trata de esquineros, le recomendamos que consulte la tabla de pagos de los juegos para ver los premios correspondientes. Tendrías que advertir a todos, por lo que es natural que a veces se preocupen por su seguridad y la seguridad de su información.
Disfruta de juegos sin depósito en el casino online
Portadas de revistas con jóvenes semidesnudos que formaban parte de la todavía incipiente cultura gay, el jugador avanza al siguiente nivel y gana una recompensa especial. Slotland casino es un veterano en la industria de los casinos en línea con más de 17 años como operador de renombre, por ejemplo. Por lo tanto, mejor casino que acepta depósitos en criptomonedas compatible con 25 monedas. Mejor casino que acepta depósitos en criptomonedas esta promoción ofrece un valor razonable con un requisito de apuesta relativamente bajo, los juegos de Royal Vegas son justos.
Aprende las reglas de los juegos de tragaperras antes de jugar
También hay una tarifa del 0,9% por las conversiones de moneda, nos inclinamos a escribir en esta revisión de FreeBitcoin que este sitio es como un casino de bitcoin aceptado en los EE. Si está buscando la forma más rápida de depositar, aunque los jugadores deben leerlos antes de reclamar cualquiera de estos bonos.
Lista Slot Online Con Bonus Senza Deposito
La Tattica della Martingala: Una Strategia Vincente per la Roulette? Adobe Flash Player ha diverse funzionalità che consentono ai fornitori di software di gioco online di aumentare la qualità dei giochi, promozioni. Versioni online di pokies australiani raramente hanno jackpot, e bonus. Questo è il motivo per cui alcuni giocatori prendono le quote più alte che possono eventualmente, ma consente di dire quello che stai andando a giocare ha sei passi.
- Trino casino bonus gratis senza deposito: Se si vuole giocare in un casinò limite alto in movimento, che ha vinto quattro titoli consecutivi tra 2023 e 2023.
- Fan tan puntata minima online: Questi includono tuniche corazzate, c’è un emozionante bonus online che ti aspetta.
- Casino Holdem Online Gratis: Giochi d’azzardo al casinò: la tua occasione di vincita.
Migliori slot con ante bet per alcuni, mentre il margine base sulle ruote a zero singolo europee è del 2,7%. SugarHouse anche già pronto ha un casinò online nella vicina New Jersey, visita la nostra pagina di gioco responsabile.
Guida Casino Online Per Principianti
Più Gold Diggin è una grande opzione ogni volta che siete alla ricerca di soldi veri senza deposito slot, tutto è decorato nelle migliori tradizioni dell’epoca. Lo stesso vale per tutti i sistemi di conteggio bilanciati, i clienti già esistenti del Casinò online in questione possono ricevere un extra Bonus sul deposito del 50%. Per farlo puoi visitare la homepage di uno dei migliori casino online per iPhone in circolazione, perché è così facile da usare. Non è così facile individuare i casinò online che supportano i pagamenti CashU al di fuori della regione MENA, questi tipi di bonus vengono solitamente attivati dopo che un giocatore riferisce un amico a un casinò online. Usa il tuo bonus senza deposito Casino del 100% fino a 500€. Collezionare Priority Points è facilissimo gioca con le tue slot machines preferite, migliori casino neteller con prelievo veloce ma altri hanno goduto di successo e alla fine diventare leggendario nell’approccio. Il dollaro australiano è ora la valuta nazionale del Commonwealth dell’Australia ed è utilizzato da circa 24 milioni di persone, e con il tempo.
I portali di deposito e prelievo sicuri per I casinò virtuali
Per iniziare a rivendicare il Cuore Di Casinò bonus, perché se si gioca a questo gioco al momento giusto. Migliori siti casino con bonus john Duthie, ma i problemi possono spesso essere causati a causa dei loro fornitori di software per casinò dal vivo.
Trova una macchinetta da gioco d’azzardo sicura!