Votre panier est actuellement vide !
Étiquette : excel_vba
Oval In Excel VBA
The type msoShapeOval is used to create an oval shape. If the width and height are equal, the shape becomes a perfect circle. Many graphic objects can contain text, which is demonstrated here with the oval:
Sub CreateOval()
    Dim Sh As Shape
    ThisWorkbook.Worksheets("Sheet3").Activate
    Set Sh = ActiveSheet.Shapes.AddShape(msoShapeOval, 130, 30, 80, 50)
    Sh.Fill.ForeColor.RGB = RGB(91, 155, 213)
    Sh.Line.DashStyle = msoLineDash
    Sh.TextFrame.Characters.Text = "Hello"
    Sh.TextFrame.Characters.Font.Color = vbYellow
    Set Sh = Nothing
End Sub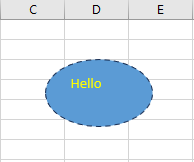
Explanation:
By specifying the type msoShapeOval, you create an oval.The DashStyle property of the shape’s line controls the style of the border line. The values come from the enumeration msoLineDashStyle. Here, msoLineDash means the line is dashed.
The TextFrame property allows you to set certain text-related properties for many shapes (though not all). Related properties include TextFrame2 and TextEffect.
The sub-property TextFrame.Characters is used to assign the actual text (via the Text property) and to set font attributes (via the Font property).
Rectangle In Excel VBA
The following example demonstrates how to create a rectangle with fill color, border line, and rotation. A rectangle is a shape of the type msoShapeRectangle.
Sub CreateRectangle()
    Dim Sh As Shape
    ThisWorkbook.Worksheets("Sheet3").Activate
    Set Sh = ActiveSheet.Shapes.AddShape(msoShapeRectangle, 30, 30, 50, 80)
    Sh.Fill.ForeColor.RGB = RGB(255, 0, 0)
    Sh.Line.ForeColor.RGB = RGB(255, 255, 0)
    Sh.Line.Weight = 3
    Sh.Rotation = 20
    Set Sh = Nothing
End Sub
Explanation:
The AddShape() method is used to create many different types of graphic objects. It takes five parameters:- Type: A value from the enumeration msoAutoShapeType. This enumeration includes well over 100 elements, each representing a specific type of graphic object. By specifying msoShapeRectangle, you create a rectangle.
- Left and Top: These specify the coordinates of the bounding frame of the new shape, measured from the top-left corner of the worksheet.
- Width and Height: These define the width and height of the bounding frame. For a rectangle, the bounding frame corresponds exactly to the shape itself. For an oval, however, the bounding frame is the invisible rectangle surrounding the oval, which becomes visible when the shape is selected.
The Fill property of a shape controls the fill formatting. Here, the sub-property ForeColor.RGB is used to set the fill color of the shape.
The Line property pertains to the line formatting of the shape. For line shapes, it controls the line itself; for larger shapes like a rectangle, it controls the border line. Here, the sub-property ForeColor.RGB sets the border color.
The Weight property sets the thickness of the border line.
The Rotation property determines the rotation angle of the graphic object in degrees, measured clockwise.
Note:
The coordinates of the shape (Left and Top) do not change when the shape is rotated, even though, for example, the position of the upper-left corner of the shape may appear shifted. Therefore, the actual position of the shape on the worksheet is determined only by the combination of Left, Top, and Rotation values.Example Formatted Pie Chart In Excel VBA
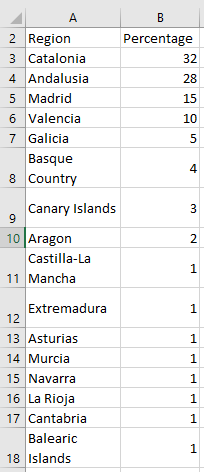
As another example of creating and formatting an embedded chart, the following illustrates a pie chart. You will notice that many general chart properties used in the line chart example can be applied here as well. However, some properties are unique to pie charts. The data source is election results from Spain in 2019,.
Code:
Sub CreatePieChart()
    Dim CO As ChartObject
    Dim CH As Chart
    Dim i As Integer
    Set CO = ThisWorkbook.Worksheets("Sheet2").ChartObjects.Add(200, 10, 400, 350)
    Set CH = CO.Chart
    ' Chart type and data source
    CH.ChartType = xlPie
    CH.SetSourceData Range("A1:B16")
    ' Chart and plot area formatting
    CH.ChartArea.Interior.Color = vbCyan
    CH.PlotArea.Interior.Color = vbYellow
    ' Title
    CH.HasTitle = True
    CH.ChartTitle.Text = "Spain 2019"
    ' Legend
    CH.HasLegend = True
    With CH.Legend
        .Interior.Color = vbYellow
        .Border.Color = vbBlue
        .Border.Weight = xlThick
    End With
    ' Data points formatting
    CH.SeriesCollection(1).Points(1).Interior.Color = vbWhite
    For i = 1 To CH.SeriesCollection(1).Points.Count
        If Cells(i + 1, 2) > 30 Then
            With CH.SeriesCollection(1).Points(i)
                .ApplyDataLabels xlDataLabelsShowLabelAndPercent
                .DataLabel.NumberFormatLocal = "0.00%"
            End With
        End If
    Next i
    Set CH = Nothing
    Set CO = Nothing
End Sub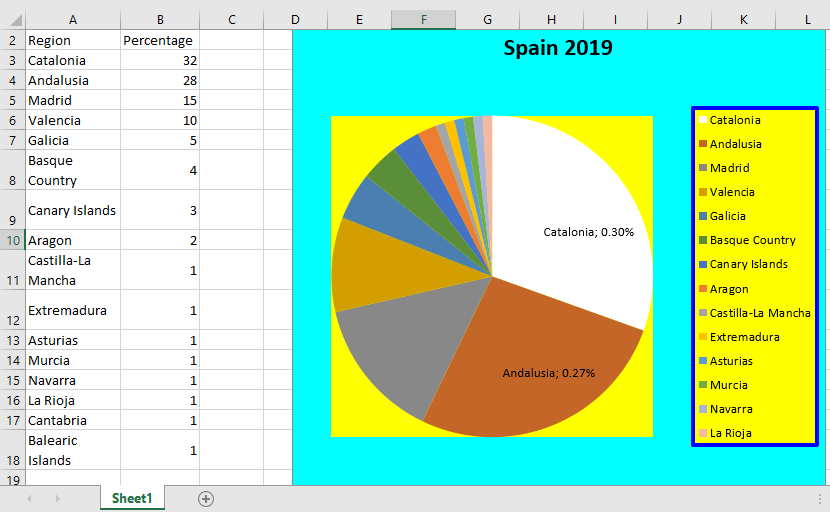
Explanation:
As known, the ChartObjects.Add() method creates a new chart frame.The chart type used is xlPie, which specifies a pie or doughnut chart.
The chart area, plot area, title, and legend can be formatted similarly to the line chart example.
However, data series behave differently in pie charts. For instance, there are no markers, but features like:
- xlDataLabelsShowLabelAndPercent — a special label type that shows both the category label and the percentage.
- An interior fill for each data point slice.
In this example, data points with values above a threshold (30 seats) receive data labels showing their category and percentage share. Additionally, the interior color of the first data point is set to white.
The DataLabel property controls the appearance of the labels. Here, the percentage is formatted to show two decimal places (« 0.00% »).
Managing Embedded Charts In Excel VBA
Similar to the previous section 7.3.1, Managing Chart Sheets, here are three procedures for copying, deleting, and exporting an embedded chart.
Copying an Embedded Chart:
Sub CopyEmbeddedChart()
    With ThisWorkbook.Worksheets("Sheet1")
        .ChartObjects(1).Copy
        .Paste
        .ChartObjects(2).Top = 250
        .ChartObjects(2).Left = 200
    End With
End Sub
Explanation:
It is assumed that the worksheet « Sheet1 » initially contains only one chart frame. This chart frame is indexed as ChartObjects(1).The Copy() method copies this chart frame (including its chart) to the clipboard.
The Paste() method pastes the copied chart frame back into the same worksheet, creating a new chart frame, which becomes ChartObjects(2).
The position of this new chart frame is set by modifying its Top and Left properties, placing it further down and to the right within the worksheet.
Deleting an Embedded Chart:
Sub DeleteEmbeddedChart()
    ThisWorkbook.Worksheets("Sheet1").ChartObjects(2).Delete
End Sub
Explanation:
The Delete() method removes the specified chart frame (here, the second chart frame on « Sheet1 ») without prompting for confirmation.Exporting an Embedded Chart as an Image:
Sub ExportEmbeddedChart()
    ThisWorkbook.Worksheets("Sheet1").ChartObjects(1).Chart.Export "C:\Temp\April.jpg"
End Sub
Explanation:
The Export() method creates an image file from the chart contained within the specified chart frame. Here, it exports the chart from the first embedded chart frame as a .jpg file to the path C:\Temp\April.jpg.Managing Chart Sheets In Excel VBA
Below are three procedures for copying, deleting, and exporting a chart sheet.
Copying a Chart Sheet:
Sub CopyChartSheet()
    ThisWorkbook.Charts("Chart1").Copy After:=Worksheets("Sheet3")
    ActiveChart.Name = "Chart1 Copy"
End Sub
Explanation:
A chart sheet can be copied just like a worksheet. The Copy() method creates a copy of the specified chart sheet, as shown in Figure 7.6. Using the Before or After parameters, you can specify the location of the copied sheet within the workbook. Without these parameters, Excel would create a new workbook containing only the copied chart sheet.Deleting a Chart Sheet:
Sub DeleteChartSheet()
    ThisWorkbook.Charts("Chart1 Copy").Delete
End Sub
Explanation:
The Delete() method removes the specified chart sheet. Before deletion, Excel prompts the user for confirmation.Exporting a Chart Sheet as an Image:
Sub ExportChartSheet()
    ThisWorkbook.Charts("Chart1").Export "C:\Users\POPOLY\Desktop\img.png"
End Sub
Explanation:
The Export() method generates an image file of the chart sheet. You must provide the filename, optionally including the directory path. The file extension determines the image format. Commonly supported formats include .jpg, .gif, and .png. The result is illustrated in Figure 7.7.Modifying an Embedded Chart In Excel VBA
The program to modify an embedded chart is structured similarly to the one used for modifying a chart sheet; it also consists of two parts. Below is the part that applies exclusively to embedded charts:
Sub ModifyEmbeddedChart()
    Dim CO As ChartObject
    Dim CH As Chart
    Set CO = ThisWorkbook.Worksheets("Sheet1").ChartObjects(1)
    CO.Left = 220
    CO.Top = 30
    CO.Width = 400
    CO.Height = 300
    Set CH = CO.Chart
    ChangeChart CH
    Set CH = Nothing
    Set CO = Nothing
End Sub
Explanation:
A variable of type ChartObject is declared and assigned to the first chart frame on the worksheet named « Sheet1 » in the workbook.Next, a variable of type Chart is declared and assigned the chart contained within this chart frame.
For embedded charts, it can be useful to adjust the position and size of the chart frame. This is done by modifying the Left, Top, Width, and Height properties of the ChartObject.
Finally, the (previously introduced) procedure ChangeChart() is called, with the reference to the chart passed as a parameter to apply the desired modifications.
Modifying a Chart Sheet In Excel VBA
First, the program code:
Sub ModifyChartSheet()
    Dim CH As Chart
    Set CH = ThisWorkbook.Charts(1)
    ChangeChart CH
    Set CH = Nothing
End Sub
This program is divided into two parts. The first part applies only to chart sheets:
A variable of type Chart is declared, and it is assigned to the first chart sheet in the workbook.
The procedure ChangeChart() is called, with the first chart sheet Charts(1) passed as a parameter.The second part of the program applies both to chart sheets and embedded charts:
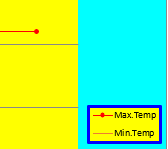
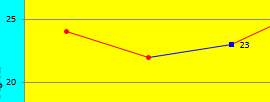
Sub ChangeChart(CH As Chart)
    ' Chart area formatting
    CH.ChartArea.Interior.Color = vbCyan
    ' Plot area formatting
    CH.PlotArea.Interior.Color = vbYellow
    ' Title
    CH.HasTitle = True
    CH.ChartTitle.Text = "Temperature"
    ' Legend
    CH.HasLegend = True
    With CH.Legend
        .Interior.Color = vbYellow
        .Border.Color = vbBlue
        .Border.Weight = xlThick
    End With
    ' Category axis
    With CH.Axes(xlCategory)
        .HasTitle = True
        .AxisTitle.Text = "Date"
        .TickLabels.NumberFormatLocal = "DD.MM."
    End With
    ' Value axis
    With CH.Axes(xlValue)
        .HasTitle = True
        .AxisTitle.Text = "Degrees"
        .MinimumScale = 5
        .MaximumScale = 35
    End With
    ' Data series
    With CH.SeriesCollection(1)
        .Border.Color = vbRed
        .MarkerStyle = xlMarkerStyleCircle
        .MarkerForegroundColor = vbRed
        .MarkerBackgroundColor = vbRed
    End With
    ' Data point
    With CH.SeriesCollection(1).Points(3)
        .Border.Color = vbBlue
        .ApplyDataLabels xlShowValue
        .MarkerStyle = xlMarkerStyleSquare
        .MarkerForegroundColor = vbBlue
        .MarkerBackgroundColor = vbBlue
    End With
End Sub
Changed chart area colors, legend, and data series
Modified axes and data point appearance
Explanation:
The ChartArea property represents the entire chart area, including the plot area, title, and legend. It has an Interior property that defines the fill (background) of this area, similar to how a cell’s interior can be formatted. In this example, the chart area’s interior color is set to cyan.The PlotArea property represents the plot area specifically—the region where the data is graphed. Its Interior color is set to yellow here.
Charts may have a title, controlled by the Boolean property HasTitle. Setting this to True enables the title; False removes it. The title text is set using the ChartTitle.Text property.
Similarly, charts can include a legend, controlled by HasLegend. Its formatting is accessible via the Legend property, which exposes Interior and Border properties. These allow setting the background color and border color/thickness of the legend box.
All chart axes are contained in the Axes collection. Each axis is an object of type Axis. To select a specific axis, the Axes() method is called with parameters:
- xlCategory for the horizontal (category) axis
- xlValue for the vertical (value) axis
In this example, both axes have titles enabled (HasTitle = True), and the title text is assigned.
For the category axis, the tick label format is customized with NumberFormatLocal to display dates as “DD.MM.”.
For the value axis, the scale is set manually by defining minimum (MinimumScale = 5) and maximum (MaximumScale = 35) values.The SeriesCollection holds all data series of a chart. Each series is a Series object. You access a series by its index starting at 1.
The series border color (which for line charts affects the line color) is set to red here. Marker appearance for data points on the series is customized with properties like MarkerStyle (e.g., circle), MarkerForegroundColor, and MarkerBackgroundColor.The Points collection contains all data points in a series. Each data point is a Point object. You select a specific point by index.
In this example, the third data point’s border color is changed to blue. Data labels showing values are applied with ApplyDataLabels xlShowValue. The marker style is set to square with blue foreground and background colors.Creating an Embedded Chart In Excel VBA
Embedded charts exist within the object hierarchy beneath worksheets. The Worksheets collection contains a sub-collection called ChartObjects, which includes all the chart frames on a given worksheet. Each ChartObject represents a single chart frame. The actual chart itself is an object of type Chart and corresponds to the Chart property of a chart frame. Apart from this organizational structure, both embedded and chart sheet charts function similarly.
The following procedure creates a simple line chart embedded directly into the worksheet named « Sheet1 »:
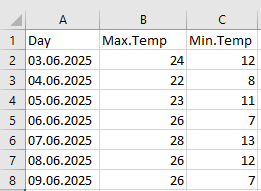
Sub CreateEmbeddedChart()
    Dim CO As ChartObject
    Dim CH As Chart
    Set CO = ThisWorkbook.Worksheets("Sheet1").ChartObjects.Add(200, 10, 300, 150)
    Set CH = CO.Chart
    CH.ChartType = xlLine
    CH.SetSourceData Worksheets("Sheet1").Range("A1:C8")
    Set CH = Nothing
    Set CO = Nothing
End Sub
The result is shown in Figure 7.3.
Figure 7.3 illustrates the embedded chart.Explanation:
First, a variable of type ChartObject is declared. This variable will later reference the newly created chart frame.Next, a variable of type Chart is declared. This will refer to the chart inside the newly created chart frame.
The ChartObjects collection holds all embedded chart frames on a worksheet. The Add() method creates a new chart frame at a specified position and size on the worksheet, returning a reference to this newly created object. The four parameters of Add() represent:
- The distance in points from the left edge of the worksheet to the left edge of the chart frame
- The distance in points from the top edge of the worksheet to the top edge of the chart frame
- The width of the chart frame in points
- The height of the chart frame in points
The Chart property of a ChartObject accesses the actual chart contained within the frame.
The ChartType property specifies the type of the chart, here set to xlLine for a line chart.
The SetSourceData() method assigns the data source for the chart. In this example, the source data is the range A1:C8 on the active worksheet.
Creating a Chart Sheet In Excel VBA
Charts placed on their own sheets (called chart sheets) exist at the same hierarchical level as worksheets within a workbook. There are several collections within a workbook that list different types of sheets:
- Sheets – contains all worksheets and chart sheets
- Worksheets – contains only worksheets (as commonly known)
- Charts – contains only chart sheets
The following procedure creates a simple line chart as a new chart sheet within the workbook:
Sub CreateChartOnNewSheet()
    ThisWorkbook.Charts.Add After:=Worksheets("Sheet1")
    With ActiveChart
        .ChartType = xlLine
        .SetSourceData Worksheets("Sheet1").Range("A1:C8")
        .Name = "Chart1"
    End With
End Sub
Explanation:
The Add() method of the Charts object creates a new chart sheet and adds it to the Charts collection of the active workbook. Similar to copying or moving worksheets, you can specify the position of the new sheet using the Before or After parameters. If no position is specified, the new sheet is inserted before the currently active sheet.
The newly created chart sheet is of type Chart and automatically becomes the active chart sheet. Therefore, it can be accessed using ActiveChart.
The ChartType property sets the type of the chart—in this case, xlLine for a line chart. Some commonly used chart types are listed below.
The SetSourceData() method defines the data source for the chart. Here, the data range is cells A1 to C8 on the worksheet named « Sheet1, » which contains the temperature data.
You can assign a name to the chart using the Name property.
Note:
The SetSourceData() method has a second optional parameter that specifies whether the chart plots data by columns (xlColumns, which is the default) or by rows (xlRows).Table 7.1 lists several chart types and their corresponding ChartType property values:
Chart Type ChartType Property Clustered Column Chart xlColumnClustered Clustered Bar Chart xlBarClustered Line Chart xlLine Pie Chart xlPie (Table 7.1: Chart Types)
Creating an Embedded Chart In Excel VBA
Embedded charts exist within the object hierarchy beneath worksheets. The Worksheets collection contains a sub-collection called ChartObjects, which includes all the chart frames on a given worksheet. Each ChartObject represents a single chart frame. The actual chart itself is an object of type Chart and corresponds to the Chart property of a chart frame. Apart from this organizational structure, both embedded and chart sheet charts function similarly.

The following procedure creates a simple line chart embedded directly into the worksheet named « Sheet1 »:
Sub CreateEmbeddedChart()
    Dim CO As ChartObject
    Dim CH As Chart
    Set CO = ThisWorkbook.Worksheets("Sheet1").ChartObjects.Add(200, 10, 300, 150)
    Set CH = CO.Chart
    CH.ChartType = xlLine
    CH.SetSourceData Worksheets("Sheet1").Range("A1:C8")
    Set CH = Nothing
    Set CO = Nothing
End Sub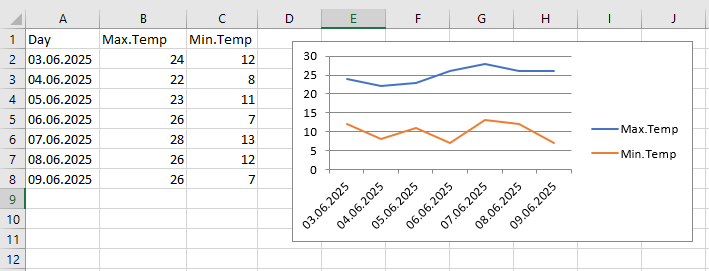
Explanation:
First, a variable of type ChartObject is declared. This variable will later reference the newly created chart frame.Next, a variable of type Chart is declared. This will refer to the chart inside the newly created chart frame.
The ChartObjects collection holds all embedded chart frames on a worksheet. The Add() method creates a new chart frame at a specified position and size on the worksheet, returning a reference to this newly created object. The four parameters of Add() represent:
- The distance in points from the left edge of the worksheet to the left edge of the chart frame
- The distance in points from the top edge of the worksheet to the top edge of the chart frame
- The width of the chart frame in points
- The height of the chart frame in points
The Chart property of a ChartObject accesses the actual chart contained within the frame.
The ChartType property specifies the type of the chart, here set to xlLine for a line chart.
The SetSourceData() method assigns the data source for the chart. In this example, the source data is the range A1:C8 on the active worksheet.