Votre panier est actuellement vide !
Étiquette : implement_advanced
Implement Advanced Technical Analysis Algorithms With Excel VBA
- Moving Averages (SMA & EMA)
Simple Moving Average (SMA)
The Simple Moving Average (SMA) is the average of a security’s price over a specific time period. It’s one of the most commonly used technical indicators to determine trends.
Exponential Moving Average (EMA)
The Exponential Moving Average (EMA) gives more weight to recent prices and reacts faster to price changes compared to the Simple Moving Average (SMA).
- Relative Strength Index (RSI)
RSI is a momentum oscillator that measures the speed and change of price movements. It ranges from 0 to 100 and is typically used to identify overbought or oversold conditions.
Step-by-Step VBA Code Explanation
The following code will calculate:
- SMA: Simple Moving Average.
- EMA: Exponential Moving Average.
- RSI: Relative Strength Index.
We’ll assume you have historical price data in an Excel worksheet in the following format:
- Column A: Date
- Column B: Closing Price (the security’s price)
Excel Sheet Layout Example:
Date Closing Price 01/01/2025 100 01/02/2025 105 01/03/2025 103 01/04/2025 110 … … Excel VBA Code:
Sub CalculateTechnicalIndicators()
    ' Define worksheet and range
    Dim ws As Worksheet
    Set ws = ThisWorkbook.Sheets("Sheet1")
    ' Define variables
    Dim lastRow As Long
    Dim i As Long
    Dim period As Integer
    Dim sma As Double, ema As Double, rs As Double
    Dim gains As Double, losses As Double
    Dim avgGain As Double, avgLoss As Double
    Dim rsi As Double
    ' Find the last row of data
    lastRow = ws.Cells(ws.Rows.Count, "A").End(xlUp).Row
    ' Set period for SMA, EMA, and RSI
    period = 14  ' 14-period for SMA, EMA, and RSI
    ' Adding Headers for SMA, EMA, and RSI columns
    ws.Cells(1, 3).Value = "SMA"
    ws.Cells(1, 4).Value = "EMA"
    ws.Cells(1, 5).Value = "RSI"
    ' Calculate SMA (Simple Moving Average)
    For i = period To lastRow
        sma = Application.WorksheetFunction.Average(ws.Range("B" & i - period + 1 & ":B" & i))
        ws.Cells(i, 3).Value = sma
    Next i
    ' Calculate EMA (Exponential Moving Average)
    ema = ws.Cells(period, 3).Value  ' Start EMA with the first SMA value
    Dim multiplier As Double
    multiplier = 2 / (period + 1)
    For i = period + 1 To lastRow
        ema = (ws.Cells(i, 2).Value - ema) * multiplier + ema
        ws.Cells(i, 4).Value = ema
    Next i
    ' Calculate RSI (Relative Strength Index)
    For i = period + 1 To lastRow
        gains = 0
        losses = 0
        ' Calculate the average gains and losses
        For j = i - period + 1 To i
            If ws.Cells(j + 1, 2).Value > ws.Cells(j, 2).Value Then
                gains = gains + (ws.Cells(j + 1, 2).Value - ws.Cells(j, 2).Value)
            Else
                losses = losses + (ws.Cells(j, 2).Value - ws.Cells(j + 1, 2).Value)
            End If
        Next j
        ' Average Gain and Loss
        avgGain = gains / period
        avgLoss = losses / period
        If avgLoss = 0 Then
            rsi = 100 ' If there are no losses, RSI is 100
        Else
            ' Calculate RS (Relative Strength) and RSI
            rs = avgGain / avgLoss
            rsi = 100 - (100 / (1 + rs))
        End If
        ' Output RSI to the worksheet
        ws.Cells(i, 5).Value = rsi
    Next i
    MsgBox "Technical Indicators Calculated Successfully!", vbInformation
End Sub
Explanation of the Code
- Initial Setup
- The ws variable represents the worksheet where the price data resides (adjust the sheet name as needed).
- We define variables like lastRow to get the last row of the data, period for the moving average and RSI period (commonly 14), and other variables to hold intermediate results.
- SMA Calculation
- For each row from the period to lastRow, we calculate the Simple Moving Average by averaging the closing prices in the last period number of rows. This is done using the Application.WorksheetFunction.Average method.
- EMA Calculation
- The Exponential Moving Average (EMA) starts with the first SMA value and then uses the multiplier (2 / (period + 1)) to calculate the next EMA values. This gives more weight to the recent closing prices.
- RSI Calculation
- For RSI, we calculate the average gain and average loss for the previous period number of closing prices. If there are no losses in the period, RSI is set to 100. Otherwise, the Relative Strength (RS) is calculated as the average gain divided by the average loss, and RSI is computed using the formula RSI = 100 – (100 / (1 + RS)).
How to Use the Code
- Open Excel and press Alt + F11 to open the VBA editor.
- In the VBA editor, click Insert > Module to create a new module.
- Paste the code into the module.
- Go back to the Excel worksheet and press Alt + F8, select CalculateTechnicalIndicators, and click Run.
This will calculate and output the following columns:
- SMA in Column C
- EMA in Column D
- RSI in Column E
Conclusion
This VBA code demonstrates how to implement some of the most commonly used technical analysis indicators in Excel. You can modify this code to incorporate additional indicators or adjust the period lengths based on your trading strategy.
Implement Advanced Sorting Algorithms With Excel VBA
- QuickSort Algorithm in VBA
QuickSort is a divide-and-conquer algorithm that works by selecting a pivot element from the array, partitioning the other elements into two sub-arrays (elements less than the pivot and elements greater than the pivot), and then recursively sorting the sub-arrays.
Steps to Implement QuickSort in VBA:
- Choose a pivot element (usually the last element).
- Partition the array into two sub-arrays.
- Recursively apply the same process to both sub-arrays.
Here’s how you can implement it in VBA:
Sub QuickSortExample()
    Dim arr As Variant
    arr = Array(3, 7, 8, 5, 2, 1, 4, 6) ' Sample array
    ' Call the QuickSort function
    QuickSort arr, LBound(arr), UBound(arr)
    ' Output the sorted array in the Immediate Window (Ctrl + G)
    For i = LBound(arr) To UBound(arr)
        Debug.Print arr(i)
    Next i
End Sub
' QuickSort Function
Sub QuickSort(ByRef arr As Variant, ByVal low As Long, ByVal high As Long)
    Dim pivot As Long
    Dim i As Long, j As Long
    Dim temp As Variant
    If low < high Then
        ' Choose a pivot and partition the array
        pivot = Partition(arr, low, high)
        ' Recursively sort the sub-arrays
        QuickSort arr, low, pivot - 1
        QuickSort arr, pivot + 1, high
    End If
End Sub
' Partition Function to rearrange elements around pivot
Function Partition(ByRef arr As Variant, ByVal low As Long, ByVal high As Long) As Long
    Dim pivot As Variant
    Dim i As Long, j As Long
    Dim temp As Variant
    pivot = arr(high) ' Last element is the pivot
    i = low - 1 ' Pointer for smaller element
    For j = low To high - 1
        If arr(j) <= pivot Then
            i = i + 1
            ' Swap arr(i) and arr(j)
            temp = arr(i)
            arr(i) = arr(j)
            arr(j) = temp
        End If
    Next j
    ' Swap arr(i + 1) and arr(high) (the pivot)
    temp = arr(i + 1)
    arr(i + 1) = arr(high)
    arr(high) = temp
    Partition = i + 1 ' Return the pivot index
End Function
Explanation of the QuickSort Code:
- QuickSort Subroutine:
- This subroutine takes the array arr and sorts it in-place.
- It calls the Partition function to rearrange the array and then recursively sorts the sub-arrays.
- low and high are the indices indicating the current sub-array being sorted.
- Partition Function:
- The pivot is selected as the last element of the sub-array (arr(high)).
- It rearranges the elements so that all elements less than the pivot are on the left and all elements greater than the pivot are on the right.
- It returns the pivot’s new index, which divides the array into two sub-arrays.
- MergeSort Algorithm in VBA
MergeSort is also a divide-and-conquer algorithm that divides the array into two halves, recursively sorts them, and then merges the sorted halves.
Steps to Implement MergeSort in VBA:
- Divide the array into two halves.
- Recursively sort the two halves.
- Merge the two sorted halves.
Here’s how you can implement it in VBA:
Sub MergeSortExample()
    Dim arr As Variant
    arr = Array(3, 7, 8, 5, 2, 1, 4, 6) ' Sample array
    ' Call the MergeSort function
    MergeSort arr, LBound(arr), UBound(arr)
    ' Output the sorted array in the Immediate Window (Ctrl + G)
    For i = LBound(arr) To UBound(arr)
        Debug.Print arr(i)
    Next i
End Sub
' MergeSort Function
Sub MergeSort(ByRef arr As Variant, ByVal low As Long, ByVal high As Long)
    Dim mid As Long
    If low < high Then
        mid = (low + high) \ 2 ' Find the middle of the array
        ' Recursively sort the left and right halves
        MergeSort arr, low, mid
        MergeSort arr, mid + 1, high
        ' Merge the sorted halves
        Merge arr, low, mid, high
    End If
End Sub
' Merge Function to merge two halves
Sub Merge(ByRef arr As Variant, ByVal low As Long, ByVal mid As Long, ByVal high As Long)
    Dim tempArr() As Variant
    Dim i As Long, j As Long, k As Long
    Dim leftSize As Long, rightSize As Long
    leftSize = mid - low + 1
    rightSize = high - mid
    ' Create temporary arrays for the two halves
    ReDim leftArr(leftSize - 1)
    ReDim rightArr(rightSize - 1)
    ' Copy data into temporary arrays
    For i = 0 To leftSize - 1
        leftArr(i) = arr(low + i)
    Next i
    For j = 0 To rightSize - 1
        rightArr(j) = arr(mid + 1 + j)
    Next j
    i = 0
    j = 0
    k = low
    ' Merge the temporary arrays back into the original array
    While i < leftSize And j < rightSize
        If leftArr(i) <= rightArr(j) Then
            arr(k) = leftArr(i)
            i = i + 1
        Else
            arr(k) = rightArr(j)
            j = j + 1
        End If
        k = k + 1
    Wend
    ' Copy any remaining elements from leftArr or rightArr
    While i < leftSize
        arr(k) = leftArr(i)
        i = i + 1
        k = k + 1
    Wend
    While j < rightSize
        arr(k) = rightArr(j)
        j = j + 1
        k = k + 1
    Wend
End Sub
Explanation of the MergeSort Code:
- MergeSort Subroutine:
- This subroutine recursively divides the array into two halves until each sub-array contains only one element.
- It calls the Merge function to combine the two halves into a sorted array.
- Merge Function:
- The Merge function combines two sorted sub-arrays into a single sorted array.
- It uses temporary arrays (leftArr and rightArr) to hold the elements of the two halves.
- It compares the elements from both halves and merges them in sorted order into the original array.
How to Use These Sorting Algorithms:
- You can call the QuickSortExample or MergeSortExample procedure in the VBA editor to test these sorting algorithms.
- You can replace the sample array arr with any data range in Excel, for example:
- arr = Range(« A1:A10 »).Value ‘ Get values from cells A1 to A10
Ensure the range contains numerical data for sorting purposes.
Conclusion:
Both QuickSort and MergeSort are efficient sorting algorithms that work well with large datasets. QuickSort is typically faster due to its partitioning strategy, but MergeSort is more predictable in terms of performance since it guarantees O(n log n) time complexity in the worst case. You can implement either algorithm in Excel VBA depending on your needs and the size of the data you’re working with.
Implement Advanced Six Sigma Analysis Techniques With Excel VBA
- Define:
In this phase, the goal is to clearly define the problem, the scope of the project, and the objectives. You need to identify the critical-to-quality (CTQ) parameters and establish the baseline for the improvement effort.
What to do in this phase:
- Define the business problem.
- Identify customers and their requirements.
- Set clear goals and objectives.
- Define the scope and boundaries of the project.
Excel VBA Code Example (Defining the Process):
You can use VBA to create a framework for the Define phase, such as setting up a template to collect data and define key parameters:
Sub DefinePhase() ' Define the business problem and parameters Dim problemDescription As String Dim goals As String Dim CTQ As String Dim scope As String Dim customerRequirements As String ' Collecting data for the define phase problemDescription = InputBox("Enter the problem description:") goals = InputBox("Enter the project goals:") CTQ = InputBox("Enter the Critical to Quality (CTQ) parameters:") scope = InputBox("Define the project scope:") customerRequirements = InputBox("Enter the customer requirements:") ' Storing the definitions in the worksheet Sheets("Define").Range("A1").Value = "Problem Description" Sheets("Define").Range("B1").Value = problemDescription Sheets("Define").Range("A2").Value = "Project Goals" Sheets("Define").Range("B2").Value = goals Sheets("Define").Range("A3").Value = "CTQ Parameters" Sheets("Define").Range("B3").Value = CTQ Sheets("Define").Range("A4").Value = "Project Scope" Sheets("Define").Range("B4").Value = scope Sheets("Define").Range("A5").Value = "Customer Requirements" Sheets("Define").Range("B5").Value = customerRequirements MsgBox "Define Phase Complete. Data Saved." End Sub- Measure:
In the Measure phase, the goal is to gather data to quantify the problem, identify the baseline performance, and understand the current process capability.
What to do in this phase:
- Identify and measure the current process performance.
- Collect baseline data (e.g., defects, cycle times).
- Use statistical tools to determine how much variation exists in the process.
Excel VBA Code Example (Measuring Process Data):
Here, you can collect process performance data, such as defects per unit, cycle time, or any relevant metrics, and store it in a worksheet for analysis.
Sub MeasurePhase() ' Collect measurement data Dim numDefects As Integer Dim totalUnits As Integer Dim cycleTime As Double Dim defectsPerUnit As Double Dim dataRange As Range ' Input data from the user (could be extended with more sophisticated methods) totalUnits = InputBox("Enter the total number of units produced:") numDefects = InputBox("Enter the total number of defects:") cycleTime = InputBox("Enter the average cycle time (in minutes):") ' Calculate Defects Per Unit (DPU) defectsPerUnit = numDefects / totalUnits ' Store the measured data Sheets("Measure").Range("A1").Value = "Total Units" Sheets("Measure").Range("B1").Value = totalUnits Sheets("Measure").Range("A2").Value = "Total Defects" Sheets("Measure").Range("B2").Value = numDefects Sheets("Measure").Range("A3").Value = "Cycle Time (minutes)" Sheets("Measure").Range("B3").Value = cycleTime Sheets("Measure").Range("A4").Value = "Defects Per Unit" Sheets("Measure").Range("B4").Value = defectsPerUnit ' Output the results MsgBox "Measure Phase Complete. Data Recorded." End Sub- Analyze:
In the Analyze phase, the goal is to understand the root causes of the problems and assess the factors contributing to defects and inefficiencies.
What to do in this phase:
- Perform statistical analysis (e.g., regression, correlation analysis).
- Identify patterns and relationships in the data.
- Use tools like Pareto charts, histograms, and control charts to visualize the problem.
Excel VBA Code Example (Data Analysis Using Regression):
You can use VBA to perform regression analysis on the data to identify relationships between variables.
Sub AnalyzePhase()
    ' Create a regression analysis on collected data
    Dim dataRange As Range
    Dim outputRange As Range
    Dim regressionResults As Object
    ' Define data range for independent and dependent variables (e.g., cycle time vs. defects)
    Set dataRange = Sheets("Measure").Range("B2:B3")  ' Independent variable
    Set outputRange = Sheets("Analyze").Range("A1")   ' Output range
    ' Run regression analysis (assuming data in columns B2 and B3)
    ' This is a placeholder for the actual regression code, which may require a more complex VBA implementation.
    ' Excel's built-in LINEST or Data Analysis Toolpak can be leveraged.
    Sheets("Analyze").Range("A1").Value = "Regression Analysis"
    Sheets("Analyze").Range("A2").Value = "Cycle Time vs Defects"
    ' Placeholder for regression results (this needs a more complex setup based on available data)
    MsgBox "Analyze Phase Complete. Data Analysis Performed."
End Sub
For detailed regression or statistical analysis, you may want to integrate Excel’s Analysis Toolpak or use functions like LINEST, CORREL, or even third-party libraries for advanced statistical analysis.
- Improve:
In this phase, the goal is to design and implement solutions to address the root causes identified in the Analyze phase. It’s about improving the process to reduce variation and defects.
What to do in this phase:
- Brainstorm and implement potential solutions.
- Use design of experiments (DOE) or other methods to test improvements.
- Implement the best solutions.
Excel VBA Code Example (Simulating Improvements):
Once the improvements are defined, you can simulate process improvements and compare them to the baseline data.
Sub ImprovePhase() ' Define improvements (example: reducing defects) Dim improvedDefects As Integer Dim improvedCycleTime As Double Dim improvedDPU As Double ' Simulate improved process results improvedDefects = InputBox("Enter the improved number of defects:") improvedCycleTime = InputBox("Enter the improved cycle time (in minutes):") ' Calculate improved defects per unit (DPU) improvedDPU = improvedDefects / totalUnits ' Store the improvement data Sheets("Improve").Range("A1").Value = "Improved Defects" Sheets("Improve").Range("B1").Value = improvedDefects Sheets("Improve").Range("A2").Value = "Improved Cycle Time" Sheets("Improve").Range("B2").Value = improvedCycleTime Sheets("Improve").Range("A3").Value = "Improved DPU" Sheets("Improve").Range("B3").Value = improvedDPu MsgBox "Improve Phase Complete. Improvements Simulated." End Sub- Control:
In the Control phase, the goal is to ensure that the improvements are sustained over time by implementing control mechanisms and monitoring the process.
What to do in this phase:
- Implement control charts and monitor the process regularly.
- Set up continuous measurement and feedback loops.
- Standardize the improved processes and ensure that any deviations are addressed promptly.
Excel VBA Code Example (Creating Control Charts):
You can use VBA to create control charts to monitor process performance after improvements have been made.
Sub ControlPhase()
    ' Create a control chart (example: X-bar chart)
    Dim chartData As Range
    Dim controlChart As ChartObject
    ' Define the data range for control chart (assume data is in column B)
    Set chartData = Sheets("Measure").Range("B1:B10")
    ' Create a control chart
    Set controlChart = Sheets("Control").ChartObjects.Add
    controlChart.Chart.SetSourceData Source:=chartData
    controlChart.Chart.ChartType = xlLine
    controlChart.Chart.HasTitle = True
    controlChart.Chart.ChartTitle.Text = "Control Chart: Process Performance"
    MsgBox "Control Phase Complete. Control Chart Created."
End Sub
Conclusion:
This implementation provides a framework for conducting Six Sigma analysis in Excel using VBA. It covers the core phases of Six Sigma, helping you systematically define, measure, analyze, improve, and control processes. Depending on your specific needs, you can expand on these examples to include more advanced statistical tools, custom reports, and automated workflows.
Implement Advanced Sensitivity Analysis Techniques With Excel VBA
- Introduction to Sensitivity Analysis in Excel
Sensitivity analysis is used to understand how different values of an independent variable (input) can affect a dependent variable (output). It is commonly used in financial modeling, risk analysis, and engineering to understand the impact of uncertainty.
There are several methods for performing sensitivity analysis in Excel:
- Scenario Analysis: This involves creating different « scenarios » (sets of assumptions) and observing how changes affect the output.
- Data Tables: These allow you to create a table of results by varying one or two input values.
- Monte Carlo Simulation: This technique uses random sampling to model the uncertainty in a system.
- Scenario Analysis in Excel VBA
Scenario Analysis involves manually defining several scenarios and then evaluating the output for each. In VBA, we can automate the creation and evaluation of scenarios.
Example:
Assume you have a financial model with three variables:
- Revenue Growth Rate (cell B2)
- Cost of Goods Sold (cell B3)
- Discount Rate (cell B4)
The formula for the output (let’s say the net present value or NPV) is in cell B5.
Step-by-Step VBA Code for Scenario Analysis:
Sub ScenarioAnalysis()
    ' Define variables
    Dim growthRate As Double
    Dim costRate As Double
    Dim discountRate As Double
    Dim npv As Double
    Dim scenarios As Variant
    Dim i As Integer
    ' Define different scenarios for input variables
    ' Each row in the array represents a different scenario with growth rate, cost rate, and discount rate
    scenarios = Array( _
        Array(0.05, 0.30, 0.10), ' Scenario 1: Growth 5%, Cost 30%, Discount 10%
        Array(0.07, 0.28, 0.09), ' Scenario 2: Growth 7%, Cost 28%, Discount 9%
        Array(0.10, 0.35, 0.12)  ' Scenario 3: Growth 10%, Cost 35%, Discount 12%
    ' Loop through scenarios
    For i = 0 To UBound(scenarios)
        growthRate = scenarios(i)(0)
        costRate = scenarios(i)(1)
        discountRate = scenarios(i)(2)
        ' Set the values of the inputs based on the current scenario
        Range("B2").Value = growthRate
        Range("B3").Value = costRate
        Range("B4").Value = discountRate
        ' Calculate the NPV (this is just an example, use your own formula here)
        npv = CalculateNPV(growthRate, costRate, discountRate
        ' Output the results in the sheet (or log them somewhere)
        Range("D" & (i + 2)).Value = "Scenario " & (i + 1)
        Range("E" & (i + 2)).Value = npv
    Next i
    MsgBox "Scenario Analysis Completed"
End Sub
' Example NPV calculation function (replace with your actual model)
Function CalculateNPV(growthRate As Double, costRate As Double, discountRate As Double) As Double
    ' Assume we have some financial model to calculate NPV
    ' For simplicity, let's return a basic formula
    CalculateNPV = (growthRate * 10000) - (costRate * 5000) / (1 + discountRate)
End Function
Explanation of the Code:
- We define a few scenarios using an array of input values for the variables (growthRate, costRate, discountRate).
- The For loop iterates through these scenarios, updating the input cells (B2, B3, B4) accordingly.
- A function CalculateNPV computes the output based on the given scenario.
- Finally, the results (NPV) for each scenario are written to the sheet.
- Data Table Analysis in Excel VBA
Data Tables are a built-in Excel feature that allow you to perform sensitivity analysis by systematically varying one or two input values. You can automate this process using VBA.
Example:
Let’s say you want to see how the NPV changes when varying both the Growth Rate and the Discount Rate.
Step-by-Step VBA Code for Data Table:
Sub DataTableAnalysis()
    ' Define variables
    Dim growthRate As Double
    Dim discountRate As Double
    Dim npv As Double
    ' Set the range where the data table will be created (use your own model ranges)
    Dim dataRange As Range
    Set dataRange = Range("A1:C6")
    ' Set row and column values for the data table
    ' First column (A2:A6) will represent different growth rates
    ' First row (B1:F1) will represent different discount rates
    dataRange.Cells(1, 1).Value = "Growth Rate\Discount Rate"
    ' Populate the growth rate values (A2:A6)
    For i = 2 To 6
        dataRange.Cells(i, 1).Value = 0.05 + (i - 2) * 0.01
    Next i
    ' Populate the discount rate values (B1:F1)
    For i = 2 To 6
        dataRange.Cells(1, i).Value = 0.08 + (i - 2) * 0.02
    Next i
    ' Fill the data table with NPV values based on growth rate and discount rate
    For i = 2 To 6
        For j = 2 To 6
            growthRate = dataRange.Cells(i, 1).Value
            discountRate = dataRange.Cells(1, j).Value
            npv = CalculateNPV(growthRate, 0.3, discountRate) ' Assume cost rate = 0.3
            dataRange.Cells(i, j).Value = npv
        Next j
    Next i
    MsgBox "Data Table Analysis Completed"
End Sub
Explanation of the Code:
- A range (dataRange) is defined where the data table will be populated.
- The first column and row are populated with varying growth rates and discount rates.
- The nested For loops iterate through all the combinations of growth and discount rates, calculating the corresponding NPV and filling the table.
- CalculateNPV is the same function used in the previous example.
- Monte Carlo Simulation in Excel VBA
Monte Carlo Simulation is a more advanced technique that uses random sampling to model the uncertainty of input variables. It helps in assessing the probability distribution of the output.
Example:
Let’s simulate how NPV varies with random inputs for Growth Rate and Discount Rate over 1000 trials.
Step-by-Step VBA Code for Monte Carlo Simulation:
Sub MonteCarloSimulation()
    ' Define variables
    Dim growthRate As Double
    Dim discountRate As Double
    Dim npv As Double
    Dim trials As Integer
    Dim i As Integer
    ' Set the number of simulation trials
    trials = 1000
    Dim npvResults() As Double
    ReDim npvResults(1 To trials)
    ' Run the simulation
    For i = 1 To trials
        ' Generate random values for growth and discount rate within given ranges
        growthRate = Rnd() * (0.15 - 0.05) + 0.05 ' Random value between 5% and 15%
        discountRate = Rnd() * (0.12 - 0.08) + 0.08 ' Random value between 8% and 12%
        ' Calculate the NPV
        npv = CalculateNPV(growthRate, 0.3, discountRate)
        ' Store the result
        npvResults(i) = npv
    Next i
    ' Output results (mean, min, max)
    Dim meanNPV As Double
    Dim minNPV As Double
    Dim maxNPV As Double
    meanNPV = Application.WorksheetFunction.Average(npvResults)
    minNPV = Application.WorksheetFunction.Min(npvResults)
    maxNPV = Application.WorksheetFunction.Max(npvResults)
    ' Output to sheet
    Range("E1").Value = "Mean NPV"
    Range("E2").Value = meanNPV
    Range("F1").Value = "Min NPV"
    Range("F2").Value = minNPV
    Range("G1").Value = "Max NPV"
    Range("G2").Value = maxNPV
    MsgBox "Monte Carlo Simulation Completed"
End Sub
Explanation of the Code:
- The Rnd() function generates random numbers between 0 and 1. We scale these values to fall within specific ranges for growth rate and discount rate.
- The simulation runs for trials iterations, calculating the NPV for each random combination of input values.
- Finally, we output the mean, minimum, and maximum NPVs to the worksheet.
Conclusion
Using Excel VBA for sensitivity analysis techniques like Scenario Analysis, Data Tables, and Monte Carlo Simulation can automate the process of understanding how changes in inputs affect outputs in your model. These methods give you powerful tools to perform both deterministic and stochastic sensitivity analysis, enabling you to make more informed decisions based on your model’s behavior.
Implement Advanced Network Optimization Techniques With Excel VBA
Creating an Excel VBA code to implement Advanced Network Optimization Techniques involves applying various concepts like linear programming, dynamic programming, optimization algorithms, and heuristic methods. Network optimization techniques often deal with finding the most efficient way to route goods, services, or data across a network. These techniques are essential in fields such as logistics, supply chain management, telecommunications, and computer networks.
- Dijkstra’s Algorithm for Shortest Path
Dijkstra’s Algorithm is one of the most popular methods for solving the shortest path problem in graph-based networks. It helps find the shortest path between a source node and all other nodes in a weighted graph.
Step-by-Step Implementation in Excel VBA
In this example, let’s assume you have a network represented in an Excel sheet where the rows and columns represent nodes, and the cells contain the weights (distances, costs, etc.) between nodes.
Steps:
- You will need a 2D array that represents the graph.
- You will implement Dijkstra’s algorithm to calculate the shortest path from a source node to all other nodes.
VBA Code Implementation:
Sub DijkstraAlgorithm()
    Dim ws As Worksheet
    Set ws = ThisWorkbook.Sheets("NetworkData") ' Change to your sheet name
    Dim n As Integer ' Number of nodes in the network
    Dim graph() As Double ' Adjacency matrix for the graph
    Dim dist() As Double ' Shortest distance array
    Dim visited() As Boolean ' Visited array to track visited nodes
    Dim previous() As Integer ' Previous node array to store the shortest path
    Dim source As Integer ' Source node
    ' Define the number of nodes in the network (e.g., 5 nodes)
    n = 5
    ' Initialize the graph matrix (2D array)
    ReDim graph(1 To n, 1 To n)
    ' Fill the graph with values (weights or distances between nodes)
    For i = 1 To n
        For j = 1 To n
            graph(i, j) = ws.Cells(i + 1, j + 1).Value ' Assume matrix data starts at B2
        Next j
    Next i
    ' Initialize arrays
    ReDim dist(1 To n)
    ReDim visited(1 To n)
    ReDim previous(1 To n)
    ' Set the source node (e.g., node 1)
    source = 1
    ' Initialize distances and visited status
    For i = 1 To n
        dist(i) = 999999 ' Set to infinity
        visited(i) = False
        previous(i) = -1 ' No previous node initially
    Next i
    dist(source) = 0 ' Distance to the source is 0
    ' Dijkstra's algorithm loop
    For i = 1 To n - 1
        Dim minDist As Double
        Dim u As Integer
        minDist = 999999 ' Set to infinity initially
        ' Find the unvisited node with the smallest distance
        For j = 1 To n
            If Not visited(j) And dist(j) < minDist Then
                minDist = dist(j)
                u = j
            End If
        Next j
        ' Mark node u as visited
        visited(u) = True
        ' Update the distances to the neighbors of u
        For v = 1 To n
            If Not visited(v) And graph(u, v) <> 0 Then
                If dist(u) + graph(u, v) < dist(v) Then
                    dist(v) = dist(u) + graph(u, v)
                    previous(v) = u
                End If
           End If
        Next v
    Next i
    ' Output the shortest distances and the shortest paths
    For i = 1 To n
        Debug.Print "Distance to Node " & i & ": " & dist(i)
        Debug.Print "Path: " & GetPath(previous, i)
    Next i
End Sub
Function GetPath(previous() As Integer, target As Integer) As String Dim path As String Dim node As Integer node = target path = CStr(node) ' Trace the path from target to source Do While previous(node) <> -1 node = previous(node) path = CStr(node) & " -> " & path LooP GetPath = path End Function
Explanation of the Code:
- Data Setup:
- The graph() matrix is a 2D array representing the network. You store distances between nodes in this matrix (assumed to be inputted in your Excel sheet).
- The dist() array holds the shortest known distance from the source node to each node.
- The visited() array tracks which nodes have been visited to prevent reprocessing.
- The previous() array stores the previous node for each node to later reconstruct the shortest path.
- Dijkstra’s Algorithm Logic:
- The algorithm iteratively picks the unvisited node with the smallest known distance, marks it as visited, and updates the distances of its neighbors.
- After running the loop, the dist() array will contain the shortest distances from the source node to every other node.
- Reconstructing the Shortest Path:
- The GetPath() function traces back from the target node to the source node using the previous() array and constructs the shortest path.
- Output:
- The distances and paths are printed in the Immediate Window in VBA.
- Linear Programming for Network Optimization
In network optimization, you often need to find the optimal allocation of resources, such as maximizing the flow through a network or minimizing transportation costs. Linear Programming (LP) is a mathematical approach to achieve this.
Example: Minimizing Transportation Cost using Solver
You can use Excel’s built-in Solver add-in to solve Linear Programming problems for network optimization. Below is an outline of how you can set it up in Excel VBA to minimize the transportation cost between multiple nodes.
Steps:
- Set up the transportation cost matrix (e.g., in an Excel sheet, CostMatrix).
- Set up the decision variables (amount of goods to transport between nodes).
- Use Solver in VBA to find the optimal solution.
VBA Code for Linear Programming using Solver:
Sub OptimizeTransportation()
    ' Set Solver references (Solver must be enabled in Excel)
    SolverReset
    SolverOk SetCell:="$B$10", MaxMinVal:=2, ValueOf:=0, ByChange:="$B$2:$B$9"
    ' Define constraints (e.g., supply and demand)
    SolverAdd CellRef:="$B$2:$B$9", Relation:=3, FormulaText:="0" ' Non-negative constraint
    SolverAdd CellRef:="$B$11:$B$14", Relation:=1, FormulaText:="10" ' Supply constraints
    ' Solve the optimization problem
    SolverSolve UserFinish:=True
End Sub
Explanation:
- SolverOk defines the objective function and decision variables.
- SolverAdd sets up the constraints, like ensuring the amounts of goods transported are non-negative and meeting supply/demand constraints.
- SolverSolve actually runs the optimization process.
Conclusion
By using techniques like Dijkstra’s Algorithm and Linear Programming, you can implement advanced network optimization in Excel VBA. Dijkstra’s Algorithm helps solve shortest path problems, while Linear Programming (with Solver) optimizes resource allocation in networks. The VBA code provided helps automate these processes for real-world scenarios such as routing and transportation.
Implement Advanced Natural Language Processing Techniques With Excel VBA
To implement advanced natural language processing (NLP) techniques using Excel VBA (Visual Basic for Applications), we can integrate various advanced NLP methods such as tokenization, part-of-speech tagging, sentiment analysis, and more. While VBA itself does not have native NLP capabilities, we can extend its functionality by leveraging external tools and APIs, such as Python, or cloud-based services like Google’s Natural Language API or IBM Watson.
- Overview of Advanced NLP Techniques
Natural Language Processing (NLP) is a branch of AI that allows computers to understand, interpret, and generate human language. Advanced NLP techniques include:
- Tokenization: Splitting text into smaller components like words or sentences.
- Part-of-speech tagging: Identifying grammatical elements (nouns, verbs, adjectives, etc.) in a sentence.
- Named entity recognition (NER): Detecting proper nouns (e.g., names of people, places, dates).
- Sentiment analysis: Identifying the sentiment behind the text (positive, negative, neutral).
- Text classification: Categorizing text into predefined categories (e.g., spam detection).
- Word embeddings: Mapping words to a continuous vector space for better semantic understanding.
While Excel VBA cannot directly handle these sophisticated NLP tasks, we can use a combination of VBA and an external API to process the text and return results to Excel.
- Step-by-Step Guide: Integrating NLP with Excel VBA
Step 1: Setting Up an API for NLP
We will use a popular cloud service like Google Cloud Natural Language API, IBM Watson, or any other provider. These APIs can handle complex NLP tasks, and you can access them via HTTP requests.
Example: Google Cloud Natural Language API
- First, you need to create a Google Cloud account and enable the Natural Language API.
- After enabling the API, generate an API key, which will be used to authenticate requests.
Google Cloud Natural Language API Documentation: Google NLP API
Step 2: Writing the VBA Code to Call the API
Now, you will use VBA to send an HTTP request to the NLP API and retrieve the response.
- Open Excel, press ALT + F11 to open the VBA editor.
- In the editor, go to Tools > References, and enable Microsoft XML, v6.0 (for HTTP requests) and Microsoft Scripting Runtime (for handling JSON).
Step 3: Example Code for Sentiment Analysis with Google Cloud NLP
This code demonstrates how to send text data to Google’s NLP API for sentiment analysis.
Sub AnalyzeSentiment()
    Dim apiKey As String
    Dim url As String
    Dim jsonData As String
    Dim http As Object
    Dim response As String
    Dim parsedJson As Object
    Dim sentimentScore As Double
    ' Your API Key from Google Cloud
    apiKey = "YOUR_GOOGLE_CLOUD_API_KEY"
    ' Define the URL for the NLP API endpoint
    url = "https://language.googleapis.com/v1/documents:analyzeSentiment?key=" & apiKey
    ' Prepare the JSON payload
    jsonData = "{ ""document"": { ""type"": ""PLAIN_TEXT"", ""content"": ""I love programming in Excel VBA!"" }, ""encodingType"": ""UTF8"" }"
    ' Create a new HTTP request object
    Set http = CreateObject("MSXML2.XMLHTTP")
    ' Open the HTTP request
    http.Open "POST", url, False
    ' Set the request headers
    http.setRequestHeader "Content-Type", "application/json"
    ' Send the request with the JSON data
    http.Send jsonData
    ' Get the response from the API
    response = http.responseText
    ' Parse the JSON response
    Set parsedJson = JsonConverter.ParseJson(response)
    ' Extract sentiment score from the response
    sentimentScore = parsedJson("documentSentiment")("score")
    ' Display the sentiment score in a cell
    Cells(1, 1).Value = "Sentiment Score: " & sentimentScore
End Sub
Explanation of the Code:
- API Key: You need to replace « YOUR_GOOGLE_CLOUD_API_KEY » with your actual Google API key.
- HTTP Request: The code constructs an HTTP POST request to the Google NLP API. It sends the text « I love programming in Excel VBA! » for sentiment analysis.
- JSON Payload: The jsonData contains the request parameters such as document type (PLAIN_TEXT) and the content to analyze.
- HTTP Response: The API returns a JSON response, and the VBA code parses this response to extract the sentiment score.
- Output: The sentiment score is displayed in cell A1 of the active Excel worksheet.
Step 4: Install the JSON Parser for VBA
VBA does not have native support for handling JSON. To parse JSON responses, you can use a free JSON parser for VBA, such as VBA-JSON.
- Download the parser from GitHub: VBA-JSON.
- In the VBA editor, go to File > Import File, and import the JsonConverter.bas file into your project.
- Advanced NLP Techniques with Other APIs
While sentiment analysis is just one example, you can easily extend the code to incorporate more advanced NLP techniques, such as:
- Tokenization and Part-of-Speech Tagging: By adjusting the API request, you can analyze the structure of sentences and tag parts of speech (nouns, verbs, etc.).
- Named Entity Recognition (NER): The Google NLP API can also detect entities like names, dates, and locations in the text.
- Text Classification: Many APIs support text classification to categorize text into predefined categories.
Here is an example code modification for Named Entity Recognition (NER):
Sub AnalyzeEntities() Dim apiKey As String Dim url As String Dim jsonData As String Dim http As Object Dim response As String Dim parsedJson As Object Dim entities As Object Dim entity As Object Dim output As String ' Your API Key from Google Cloud apiKey = "YOUR_GOOGLE_CLOUD_API_KEY" ' Define the URL for the NLP API endpoint url = "https://language.googleapis.com/v1/documents:analyzeEntities?key=" & apiKey ' Prepare the JSON payload for NER jsonData = "{ ""document"": { ""type"": ""PLAIN_TEXT"", ""content"": ""Barack Obama was born in Hawaii."" }, ""encodingType"": ""UTF8"" }" ' Create a new HTTP request object Set http = CreateObject("MSXML2.XMLHTTP") ' Open the HTTP request http.Open "POST", url, False ' Set the request headers http.setRequestHeader "Content-Type", "application/json" ' Send the request with the JSON data http.Send jsonData ' Get the response from the API response = http.responseText ' Parse the JSON response Set parsedJson = JsonConverter.ParseJson(response) ' Extract the entities from the response Set entities = parsedJson("entities") ' Initialize the output string output = "Entities Found:" & vbCrLf ' Loop through entities and output their names For Each entity In entities output = output & entity("name") & vbCrLf Next entity ' Display the output in cell A1 Cells(1, 1).Value = output End Sub- Key Points to Consider
- API Limitations and Cost: Many NLP APIs offer limited free usage, but extensive use may require paid plans.
- Error Handling: The provided code does not include error handling. In production, consider adding checks for API errors or network issues.
- Security: Ensure that your API keys are kept secure. Never hard-code them into your final product without obfuscation.
Conclusion
Excel VBA can integrate advanced NLP techniques by connecting to external APIs. This allows you to perform tasks like sentiment analysis, entity recognition, and more, directly within Excel. By leveraging powerful APIs like Google Cloud’s NLP API, you can significantly enhance Excel’s capabilities with advanced natural language understanding features.
Implement Advanced Monte Carlo Simulations With Excel VBA
What is Monte Carlo Simulation?
Monte Carlo Simulation is a computational algorithm used to simulate the behavior of a system by generating random variables. It allows you to model the probability of different outcomes in processes that involve uncertainty.
Why Monte Carlo Simulation?
Monte Carlo Simulation helps you to:
- Estimate the impact of risk and uncertainty in prediction models.
- Simulate the probability distribution of a given system.
- Analyze the range of possible outcomes (e.g., in stock price movements, engineering projects, etc.).
In an Excel environment, it is useful for modeling complex financial scenarios, such as stock prices, option pricing, or risk assessments.
Steps to Implement Advanced Monte Carlo Simulations in Excel VBA
- Modeling the Random Variables:
First, we need to identify the random variables. Monte Carlo simulations rely heavily on randomness. You can generate random numbers using the RAND or RANDBETWEEN functions in Excel. For more sophisticated random variables, you might want to use distributions like normal, uniform, or triangular.
- Setting up the Model:
Let’s assume we want to simulate the future price of a stock using a Geometric Brownian Motion (GBM) model, which is commonly used for stock prices. The GBM is defined by the following equation:
S(t)=S(0)×e(r−0.5σ2)t+σtZS(t) = S(0) \times e^{(r - 0.5 \sigma^2) t + \sigma \sqrt{t} Z}Where:
- S(t)S(t) is the stock price at time tt.
- S(0)S(0) is the initial stock price.
- rr is the risk-free rate.
- σ\sigma is the volatility of the stock.
- ZZ is a random variable following a standard normal distribution.
- Implementing the Simulation in VBA:
We will now write the VBA code to perform Monte Carlo simulations. This will simulate the price paths of the stock and calculate the final price after a set number of periods.
Excel VBA Code for Monte Carlo Simulation (Stock Price Simulation)
Sub MonteCarloSimulation()
    ' Define parameters for the simulation
    Dim initialPrice As Double
    Dim riskFreeRate As Double
    Dim volatility As Double
    Dim timePeriod As Double
    Dim numSimulations As Long
    Dim numSteps As Long
    Dim finalPrice As Double
    Dim i As Long, j As Long
    Dim randomShock As Double
    Dim pricePath() As Double
    Dim avgFinalPrice As Double
    Dim stdDev As Double
    ' Initialize parameters
    initialPrice = 100 ' Initial stock price
    riskFreeRate = 0.05 ' Risk-free rate (5%)
    volatility = 0.2 ' Volatility (20%)
    timePeriod = 1 ' Time period (1 year)
    numSimulations = 1000 ' Number of simulations
    numSteps = 252 ' Number of steps (daily time steps for 1 year)
    ' Initialize the result variables
    avgFinalPrice = 0
    stdDev = 0
    ' Loop through each simulation
    ReDim pricePath(1 To numSteps)
    For i = 1 To numSimulations
        ' Set the initial price for each simulation
        pricePath(1) = initialPrice
        ' Simulate the price path
        For j = 2 To numSteps
            randomShock = WorksheetFunction.NormSInv(Rnd()) ' Standard normal random shock
            pricePath(j) = pricePath(j - 1) * Exp((riskFreeRate - 0.5 * volatility ^ 2) * (timePeriod / numSteps) + volatility * Sqr(timePeriod / numSteps) * randomShock)
        Next j
        ' Get the final price after all steps for this simulation
        finalPrice = pricePath(numSteps)
        ' Update the average and standard deviation of the final prices
        avgFinalPrice = avgFinalPrice + finalPrice
        stdDev = stdDev + finalPrice ^ 2
    Next i
    ' Calculate the average and standard deviation
    avgFinalPrice = avgFinalPrice / numSimulations
    stdDev = Sqr((stdDev / numSimulations) - avgFinalPrice ^ 2)
    ' Output the results
    Debug.Print "Average Final Price: " & avgFinalPrice
    Debug.Print "Standard Deviation: " & stdDev
    MsgBox "Simulation Completed!" & vbCrLf & "Average Final Price: " & avgFinalPrice & vbCrLf & "Standard Deviation: " & stdDev
End Sub
Explanation of the Code:
- Parameters Setup:
- initialPrice: The initial stock price.
- riskFreeRate: The risk-free rate (typically the rate of return on government bonds).
- volatility: The volatility of the stock price (measured by standard deviation).
- timePeriod: The total time over which the simulation is performed (1 year, for example).
- numSimulations: The number of Monte Carlo simulations to run.
- numSteps: The number of time steps (e.g., daily steps for a year, so 252 for trading days in a year).
- Looping Through Simulations:
- For each simulation, the initial stock price is set.
- A loop generates the stock price path using the GBM equation at each time step.
- NormSInv(Rnd()) generates a standard normal random shock (i.e., Z in the GBM model).
- Price Path Simulation:
- Each step of the price is calculated based on the previous price, risk-free rate, volatility, and the random shock.
- Final Price Calculation:
- After the simulation of the entire period, the final price of the stock is recorded.
- Statistical Results:
- After all simulations are run, the average and standard deviation of the final prices are calculated and displayed.
What You Get:
- Average Final Price: This is the mean of all the simulated final stock prices.
- Standard Deviation: This measures how much the final prices vary from the average, providing insight into the risk or uncertainty.
Advanced Concepts You Can Implement:
- Multiple Asset Models: Simulate portfolios with multiple assets and correlations between them.
- Option Pricing: Use the Monte Carlo method to price options (e.g., using the Black-Scholes model or binomial models).
- Time-varying Volatility: Simulate models where volatility changes over time (e.g., GARCH models).
- Path Dependency: Incorporate path-dependent options such as Asian options or barrier options.
Conclusion:
This VBA code gives a basic but robust framework for running advanced Monte Carlo simulations in Excel. You can extend this to various financial or scientific problems by modifying the underlying models, adding more random variables, or changing the distribution to match your specific case.
Implement Advanced Marketing Analytics Models With Excel VBA
Implementing Advanced Marketing Analytics Models such as RFM Analysis (Recency, Frequency, Monetary) in Excel using VBA involves building a comprehensive script to help marketers analyze customer behavior and identify target groups for marketing campaigns. RFM analysis is one of the most commonly used techniques for customer segmentation.
Steps to Implement RFM Analysis in Excel Using VBA
- Understand RFM Analysis:
- Recency (R): How recently a customer has made a purchase. More recent purchases suggest higher engagement.
- Frequency (F): How often a customer makes a purchase. Higher frequency means more loyalty.
- Monetary (M): How much money a customer spends. High spenders are more valuable.
- Structure of Data: Ensure your Excel data is structured correctly. Each row should represent a customer transaction, and you should have at least the following columns:
- Customer ID
- Transaction Date
- Amount Spent
Code Implementation
Let’s break down the process of implementing the RFM model using VBA.
Example VBA Code for RFM Analysis:
Sub RFM_Analysis()
    ' Define the worksheet and data range
    Dim ws As Worksheet
    Set ws = ThisWorkbook.Sheets("Data") ' Change "Data" to the sheet where your data is stored
    ' Define last row of data (assuming data starts at row 2)
    Dim lastRow As Long
    lastRow = ws.Cells(ws.Rows.Count, "A").End(xlUp).Row
    ' Create new columns for Recency, Frequency, and Monetary
    ws.Cells(1, 4).Value = "Recency"
    ws.Cells(1, 5).Value = "Frequency"
    ws.Cells(1, 6).Value = "Monetary"
    ' Step 1: Calculate Recency, Frequency, and Monetary for each customer
    Dim customerDict As Object
    Set customerDict = CreateObject("Scripting.Dictionary")
    Dim i As Long
    Dim custID As Variant
    Dim transDate As Date
    Dim amountSpent As Double
    ' Loop through each row to calculate RFM
    For i = 2 To lastRow
        custID = ws.Cells(i, 1).Value ' Customer ID
        transDate = ws.Cells(i, 2).Value ' Transaction Date
        amountSpent = ws.Cells(i, 3).Value ' Amount Spent
        ' Initialize customer record if not already present
        If Not customerDict.exists(custID) Then
            customerDict.Add custID, Array(Date, 0, 0) ' [Last Transaction Date, Frequency, Total Amount]
        End If
        ' Update the customer record
        Dim customerData As Variant
        customerData = customerDict(custID)
        ' Recency: Calculate the difference from the most recent purchase date
        If transDate > customerData(0) Then
            customerData(0) = transDate
        End If
        ' Frequency: Count the number of purchases
        customerData(1) = customerData(1) + 1
        ' Monetary: Sum of all purchase amounts
        customerData(2) = customerData(2) + amountSpent
        ' Update the dictionary with the latest values
        customerDict(custID) = customerData
    Next i
    ' Step 2: Output the RFM values into the worksheet
    Dim rowIndex As Long
    rowIndex = 2 ' Start writing from row 2
    For Each custID In customerDict.keys
        Dim customerData As Variant
        customerData = customerDict(custID)
        ws.Cells(rowIndex, 4).Value = Date - customerData(0) ' Recency: Difference between today and last transaction
        ws.Cells(rowIndex, 5).Value = customerData(1) ' Frequency: Number of transactions
        ws.Cells(rowIndex, 6).Value = customerData(2) ' Monetary: Total amount spent
        rowIndex = rowIndex + 1
    Next custID
    ' Step 3: Rank Customers by Recency, Frequency, and Monetary
    RankRFM ws, lastRow
   End Sub
' Helper function to rank RFM values
Sub RankRFM(ws As Worksheet, lastRow As Long)
    ' Rank Recency (lower is better)
    ws.Range("D2:D" & lastRow).Sort Key1:=ws.Range("D2"), Order1:=xlAscending, Header:=xlNo
    ' Rank Frequency (higher is better)
    ws.Range("E2:E" & lastRow).Sort Key1:=ws.Range("E2"), Order1:=xlDescending, Header:=xlNo
    ' Rank Monetary (higher is better)
    ws.Range("F2:F" & lastRow).Sort Key1:=ws.Range("F2"), Order1:=xlDescending, Header:=xlNo
    ' Add a "RFM Score" based on Recency, Frequency, and Monetary
    ws.Cells(1, 7).Value = "RFM Score"
    Dim i As Long
    For i = 2 To lastRow
        ws.Cells(i, 7).Value = ws.Cells(i, 4).Value + ws.Cells(i, 5).Value + ws.Cells(i, 6).Value
    Next i
    ' Sort by RFM Score to identify top customers
    ws.Range("G2:G" & lastRow).Sort Key1:=ws.Range("G2"), Order1:=xlDescending, Header:=xlNo
End Sub
Explanation of the Code:
- Initial Setup:
- The code starts by referencing the worksheet where the transaction data is stored (ws), and it identifies the last row of data (lastRow).
- Creating Columns for RFM:
- New columns for Recency, Frequency, and Monetary are added to the worksheet to store these values for each customer.
- Calculating RFM Metrics:
- A dictionary (customerDict) is used to store the data for each customer, including:
- Last Transaction Date (Recency),
- Frequency (number of transactions),
- Monetary (total amount spent).
- The loop goes through each row and updates these values for each customer. If a customer has made multiple transactions, it updates their frequency, last transaction date, and total amount spent.
- A dictionary (customerDict) is used to store the data for each customer, including:
- Output RFM Values:
- Once the data has been processed, the RFM values are written into the respective columns in the worksheet.
- Ranking the RFM Values:
- The customers are ranked based on their RFM values. For Recency, a lower value means better ranking (because a more recent purchase indicates higher engagement). For Frequency and Monetary, a higher value means better ranking (because frequent and high-spending customers are more valuable).
- RFM Score:
- An RFM Score is calculated by adding the Recency, Frequency, and Monetary values. This score can be used to further segment customers for targeted marketing.
- Sorting by RFM Score:
- Finally, the data is sorted based on the RFM Score to help you identify the most valuable customers for your marketing efforts.
How This Model Works:
- Recency: Customers who purchased recently (lower Recency score) are considered more engaged and are more likely to respond to marketing efforts.
- Frequency: Customers who purchase more often (higher Frequency score) are more loyal and should be nurtured for repeat purchases.
- Monetary: Customers who spend more (higher Monetary score) contribute more to revenue and are prime candidates for high-value marketing campaigns.
Conclusion:
This VBA code provides a powerful, automated method to calculate RFM values in Excel, helping you segment your customers based on their purchasing behavior. With these insights, you can create more targeted marketing campaigns, increase customer retention, and boost overall marketing ROI
Implement Advanced Machine Learning Models with Excel VBA
Implementing advanced machine learning models in Excel VBA is quite a challenge because VBA is not inherently designed to handle complex machine learning tasks. However, it can be used to create the structure for importing data, running simple models, and even interfacing with external libraries (such as Python or R) that specialize in machine learning.
Here’s a detailed guide on how you can use Excel VBA to implement machine learning models. We’ll focus on implementing a simple linear regression model using VBA, as an example. Then, I’ll explain how you can enhance this approach by interfacing VBA with Python or R for more advanced models.
Step 1: Prepare Data in Excel
- Organize your data: Before you implement any machine learning model, make sure your data is structured properly in Excel. For example, you might have data in the following format:
Feature1 Feature2 Target 1 2 3 2 3 5 3 4 7 … … … - Normalize/Scale Data (Optional): Depending on the complexity of your model, it might be beneficial to scale or normalize your data. For example, if you plan to implement a model like logistic regression or SVM, feature scaling might be necessary.
Step 2: Simple Linear Regression in VBA
We’ll start by implementing a simple linear regression algorithm (a type of supervised learning) using Excel VBA. This will help you get started with the basics of machine learning.
Linear Regression Formula
The linear regression model is based on the equation:
y=β0+β1×1+β2×2+⋯+βnxny
Where:
- y is the target variable
- x1,x2,…,xn are the feature variables
- β0,β1,…,βn\ are the regression coefficients (weights) that the model will learn.
To solve this, you need to calculate the values of the regression coefficients using the Ordinary Least Squares (OLS) method.
VBA Code for Linear Regression
Here’s a VBA implementation for simple linear regression with multiple features.
- Press Alt + F11 to open the VBA editor in Excel.
- Click Insert > Module to create a new module.
- Copy and paste the following code:
Sub LinearRegression()
    Dim X As Range
    Dim Y As Range
    Dim XTransposed As Range
    Dim XTX As Range
    Dim XTX_inv As Range
    Dim XTY As Range
    Dim coefficients As Range
    Dim beta As Variant
    Dim i As Integer
    Dim j As Integer
    ' Define the ranges for your data
    Set X = Range("A2:B5") ' Features (multiple columns of features)
    Set Y = Range("C2:C5") ' Target variable
    ' Step 1: Prepare the data matrix (add a column of 1s for the intercept)
    Set XTransposed = Application.WorksheetFunction.Transpose(X)
    XTransposed.Cells(1, 1).Value = 1 ' Adding the intercept (bias term)
    ' Step 2: Calculate (X'X) (Transpose of X multiplied by X)
    Set XTX = Application.WorksheetFunction.MMult(XTransposed, X)
    ' Step 3: Inverse of (X'X)
    Set XTX_inv = Application.WorksheetFunction.MInverse(XTX)
    ' Step 4: Calculate (X'Y) (Transpose of X multiplied by Y)
    Set XTY = Application.WorksheetFunction.MMult(XTransposed, Y)
    ' Step 5: Calculate the regression coefficients (Beta = (X'X)^(-1) * X'Y)
    Set coefficients = Application.WorksheetFunction.MMult(XTX_inv, XTY)
    ' Output the coefficients to the worksheet
    For i = 1 To coefficients.Rows.Count
        Cells(i, 5).Value = coefficients.Cells(i, 1).Value ' Display the coefficients in column E
    Next i
End Sub
Explanation of the Code:
- Data Preparation:
- X represents the feature matrix (the independent variables).
- Y represents the target variable (the dependent variable).
- We add a column of 1s to X to account for the intercept term (β0).
- Matrix Operations:
- XTX calculates the dot product of the transposed feature matrix (X’) and X. This is part of the OLS formula.
- XTX_inv calculates the inverse of XTX.
- XTY calculates the dot product of the transposed feature matrix (X’) and the target values Y.
- Calculate Coefficients:
- The coefficients (β0, β1, etc.) are found by multiplying the inverse of XTX with XTY.
- Display Results:
- The regression coefficients are printed in column E of the worksheet.
Step 3: Improve with Python or R Integration
While Excel VBA can handle basic regression models like the one above, it’s not the ideal environment for more complex models (like decision trees, SVMs, deep learning, etc.). For that, we can call Python or R scripts from Excel VBA.
Example: Running a Python Script from VBA
- Install Python: Ensure you have Python installed along with the necessary libraries, such as scikit-learn, pandas, and numpy.
- Create the Python Script (e.g., linear_regression.py):
import pandas as pd
from sklearn.linear_model import LinearRegression
# Read data from a CSV file (or directly from Excel)
data = pd.read_csv('data.csv')
# Separate features and target
X = data[['Feature1', 'Feature2']]
y = data['Target']
# Fit the model
model = LinearRegression()
model.fit(X, y)
# Output the coefficients
coefficients = model.coef_
intercept = model.intercept_
print("Intercept:", intercept)
print("Coefficients:", coefficients)
VBA to Call the Python Script:
Sub RunPythonScript()
    Dim objShell As Object
    Dim pythonScript As String
    Dim pythonExe As String
    ' Path to the Python executable
    pythonExe = "C:\Path\To\Python\python.exe"
    ' Path to the Python script
    pythonScript = "C:\Path\To\Script\linear_regression.py"
    ' Run the Python script
    Set objShell = CreateObject("WScript.Shell")
    objShell.Run pythonExe & " " & pythonScript, 1, True
End Sub
Step 4: Advanced Machine Learning Models
For more complex models, like decision trees, random forests, neural networks, or deep learning, Python (via scikit-learn, tensorflow, etc.) or R (via caret, randomForest, etc.) is the way to go. You can preprocess the data in Excel, export it as a CSV, and then use VBA to run the Python or R scripts.
Conclusion
This approach allows you to get started with machine learning in Excel using VBA, with linear regression as an example. Although VBA isn’t suited for complex machine learning tasks, it can serve as a useful interface to preprocess data, call external scripts, and handle simple tasks. For more advanced models, leveraging Python or R in conjunction with VBA will give you greater flexibility and power.
Implement Advanced Inventory Management Algorithms with Excel VBA
I will walk you through both concepts step by step, including how to implement them in Excel VBA.
- ABC Analysis
ABC Analysis is a method for classifying inventory into three categories (A, B, and C) based on their importance, typically using the annual consumption value.
Steps to implement ABC Analysis:
- Category A: These are the most important items, usually accounting for 70-80% of the value, but only a small percentage (10-20%) of the items.
- Category B: These items represent a moderate value, accounting for about 15-25% of the value, and 20-30% of the items.
- Category C: These are the least important, but usually make up a large percentage of the inventory in terms of volume (50-60% of items), yet only account for 5-10% of the value.
Steps to implement in VBA:
- Calculate the Annual Consumption Value for each item by multiplying the unit cost by the annual demand (usage).
- Sort items by Annual Consumption Value in descending order.
- Compute cumulative consumption percentage and classify items into A, B, or C based on their contribution to total value.
Excel VBA Code for ABC Analysis:
Sub ABCAnalysis()
    Dim ws As Worksheet
    Set ws = ThisWorkbook.Sheets("Inventory") ' Change to your sheet name
    Dim lastRow As Long
    lastRow = ws.Cells(ws.Rows.Count, "A").End(xlUp).Row ' Assuming data starts from row 2
    ' Columns (Assumed): A=Item, B=Unit Cost, C=Annual Demand, D=Annual Consumption Value, E=ABC Category
    Dim totalConsumptionValue As Double
    totalConsumptionValue = Application.WorksheetFunction.Sum(ws.Range("D2:D" & lastRow)) ' Sum of Consumption Values
    Dim cumulativeConsumptionValue As Double
    cumulativeConsumptionValue = 0
    ' Step 1: Calculate Annual Consumption Value (Unit Cost * Annual Demand)
    Dim i As Long
    For i = 2 To lastRow
        ws.Cells(i, 4).Value = ws.Cells(i, 2).Value * ws.Cells(i, 3).Value ' Annual Consumption Value (Unit Cost * Annual Demand)
    Next i
    ' Step 2: Sort the inventory by Annual Consumption Value (Column D) in descending order
    ws.Range("A1:E" & lastRow).Sort Key1:=ws.Range("D2:D" & lastRow), Order1:=xlDescending, Header:=xlYes
    ' Step 3: Calculate cumulative percentage of the total consumption value
    For i = 2 To lastRow
        cumulativeConsumptionValue = cumulativeConsumptionValue + ws.Cells(i, 4).Value
        ws.Cells(i, 5).Value = cumulativeConsumptionValue / totalConsumptionValue * 100 ' Cumulative percentage
        ' Step 4: Classify into A, B, or C based on cumulative percentage
        If ws.Cells(i, 5).Value <= 80 Then
            ws.Cells(i, 5).Value = "A"
        ElseIf ws.Cells(i, 5).Value <= 95 Then
            ws.Cells(i, 5).Value = "B"
        Else
            ws.Cells(i, 5).Value = "C"
        End If
    Next i
    MsgBox "ABC Analysis Complete!"
End Sub
Explanation of ABC Analysis Code:
- Item Classification:
- Annual Consumption Value is calculated in column D by multiplying the unit cost (column B) by the annual demand (column C).
- The data is sorted by the annual consumption value (column D), from highest to lowest.
- The cumulative consumption percentage is calculated, which is the sum of the annual consumption value divided by the total consumption value.
- The ABC classification is based on cumulative percentage:
- A: Top 70-80% of the value.
- B: Next 15-25% of the value.
- C: The remaining 5-10% of the value.
- Economic Order Quantity (EOQ)
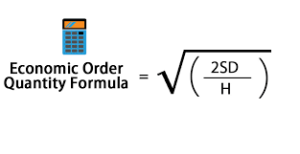
Steps to implement EOQ in VBA:
- Define the parameters: Demand (D), Ordering cost (S), and Holding cost (H).
- Calculate EOQ using the formula.
- You can also calculate the total inventory cost, which is the sum of the ordering cost and holding cost.
Excel VBA Code for EOQ Calculation:
Sub EOQCalculation()
    Dim ws As Worksheet
    Set ws = ThisWorkbook.Sheets("Inventory") ' Change to your sheet name
    Dim lastRow As Long
    lastRow = ws.Cells(ws.Rows.Count, "A").End(xlUp).Row ' Assuming data starts from row 2
    ' Columns (Assumed): A=Item, B=Annual Demand (D), C=Ordering Cost (S), D=Holding Cost (H), E=EOQ, F=Total Cost
    Dim EOQ As Double
    Dim orderingCost As Double, holdingCost As Double, demand As Double
    Dim i As Long
    For i = 2 To lastRow
        ' Step 1: Get Demand, Ordering Cost, and Holding Cost
        demand = ws.Cells(i, 2).Value
        orderingCost = ws.Cells(i, 3).Value
        holdingCost = ws.Cells(i, 4).Value
        ' Step 2: Calculate EOQ using the EOQ formula
        EOQ = Sqr((2 * demand * orderingCost) / holdingCost)
        ' Step 3: Calculate Total Cost (Ordering Cost + Holding Cost)
        ws.Cells(i, 5).Value = EOQ ' Store EOQ in column E
        ws.Cells(i, 6).Value = (demand / EOQ) * orderingCost + (EOQ / 2) * holdingCost ' Total cost in column F
    Next i
    MsgBox "EOQ Calculation Complete!"
End Sub
Explanation of EOQ Code:
- Inputs:
- Demand (D), Ordering Cost (S), and Holding Cost (H) are obtained from the spreadsheet for each item.
- EOQ Calculation: The EOQ formula is implemented using Sqr((2 * D * S) / H), and the result is stored in column E.
- Total Cost Calculation: The total inventory cost for each item is calculated as:
- Ordering Cost: DEOQ×S\frac{D}{EOQ} \times S
- Holding Cost: EOQ2×H\frac{EOQ}{2} \times H
Summary:
- The ABC Analysis helps in classifying inventory into three categories based on their importance, aiding in prioritizing items for inventory management.
- The EOQ model helps to calculate the optimal order quantity to minimize inventory costs, balancing between holding costs and ordering costs.
These two techniques are fundamental for effective inventory management and can be easily implemented in Excel VBA to automate the process.